Register For Our Mailing List

Register to receive our free weekly newsletter including editorials.

Home / 403

Do bonds still offer a buffer to equity volatility?

The relationship between bonds and equities is a feature of all balanced portfolios, especially how the price of one moves in relation to the other. Correlation is a measure of the strength of the co-movement, with a positive correlation indicating prices usually move in the same direction.

As this relationship drives the performance of superannuation for many Australians, it’s useful to know how the correlation between bonds and equities has varied over longer time periods. This article also looks at some of the key drivers of the correlation structure, and how different levels of correlation impact a portfolio’s performance.

Correlation between bonds and equities over longer time periods

Questioning the persistence of the negative correlation between equity and investment grade fixed income price returns (that is, when equities rise, bond prices fall and rates rise, or when equities fall, bond prices rise and rates fall) has become timely because of the intersection of a few topics.

In particular, co-movement of the equity and sovereign bond markets during the March 2020 market sell-off reignited the concern about the hedging potential offered by fixed income assets. This led to a reinvestigation of the sovereign bond-equity correlation relationship, a relationship that has been negative over the past two decades. Many argue that much of this negative correlation can be attributed to the lowering and persistently low levels of inflation over this same period.

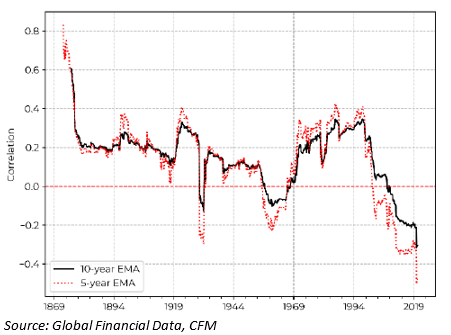
While stock and government bond prices have been moving in opposite directions since the beginning of the new millennium, the correlation prior to around 1997 in the US, as seen below, was broadly positive for more than a century. Using data going back to the mid-19th century, the correlation between equities and bonds has been mostly positive, making the recent and consistent stretch of negative correlation the anomaly, rather than the rule. (EMA=Exponential Moving Average).

Long-term evidence of positive correlation between bonds and equities

How do different levels of correlation impact returns?

Investors use the Sharpe ratio as a measure of risk-adjusted returns, or how much excess return you receive for taking more risk. You would expect a higher return from an equity portfolio than a bond portfolio over time because equities are more volatile (and, by this measure, riskier).

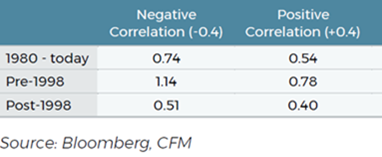
The table below shows the Sharpe ratios of a 60/40 portfolio in three different time periods: 1980-today, 1980-1998 and 1998-today.

The latter two periods are characterised by the flip in correlation that occurred in 1997. In the first column of the table, we assume an arbitrary -0.4 correlation between equities and bonds and recalculate the Sharpe ratios. We repeat for the second column with an arbitrary +0.4 correlation.

What is striking is the increase in pre-1998 Sharpe ratio from 0.78 to 1.14 by flipping the correlation, and from 0.40 to 0.51 following the same flip in sign for the period post-1998. So the risk-adjusted returns of a 60/40 portfolio are very sensitive to the level of correlation between equities and bonds!

How have other ‘safe-haven’ assets performed in difficult markets?

Asset managers have become accustomed to being able to rush into the safest and most liquid of assets, typically US treasuries, as a hedge when equity markets sell-off.

The ‘protective’ property of so-called ‘safe-haven’ assets such as US treasuries (and other low risk sovereign debt, gold, and especially the currencies of the US, Japan, and Switzerland) has been called upon to hedge equity exposure in periods of high (and often continued) market stress and significant drawdowns.

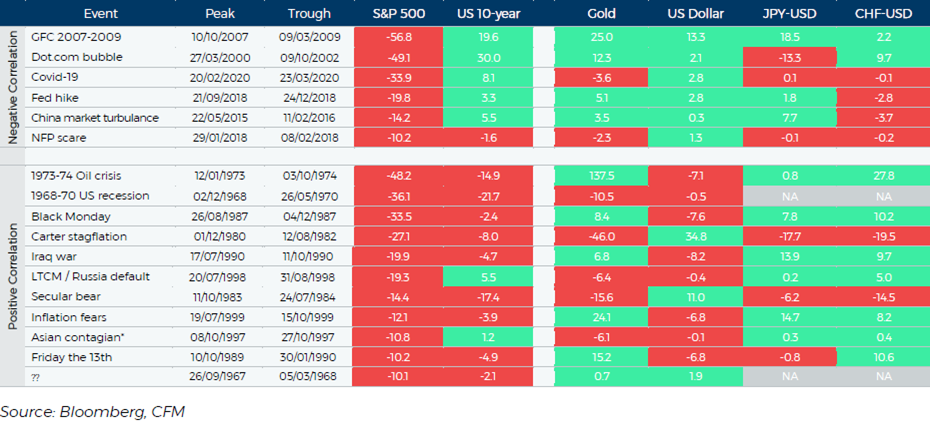
However, this market feature, looking back over the past 60 years, has only recently been available to all investors. In the table below we show all equity drawdowns (market falls) greater than 10% since the 1960s. We tabulate the total return of the S&P 500 from peak to trough, along with the comparative total return of US treasuries along with other major safe-haven assets. There is a distinctive pattern, corresponding with the correlation structure of equities and bonds as discussed above.

Before the end of the 90s, bonds typically moved in lockstep with equities, offering no protection to investors during these, the most severe drawdowns. Even in the couple of cases it did, the returns were marginal. However, after the end of the 90s, the pattern changed markedly, when, in most cases, bonds acted as an effective hedge against the equity sell-off.

Our conclusions

Given these observations, both the return and hedging potential of bonds are reduced when interest rates are low and correlations are positive.

If bonds become a less effective hedge for portfolios, investors will be left with few choices other than an expensive portfolio of options. We think they would be better advised to look for alternatives to bonds for diversification in the current environment.


Craig Stanford is a Director of Capital Fund Management. This article is general information and does not consider the circumstances of any investor. Any description or information involving investment process or allocations is provided for illustration purposes only. There can be no assurance that these statements are or will prove to be accurate or complete in any way. All figures are unaudited. This article does not constitute an offer or solicitation to subscribe for any security or interest.


RELATED ARTICLES

An insider's view of the last financial crisis

Do private investments belong in a diversified portfolio?

Stocks are less risky than bonds in the long term

banner

Most viewed in recent weeks

Finding the best income-yielding assets

With fixed term deposit rates declining and bank hybrids being phased out, what are the best options for investors seeking income? This goes through the choices, and the opportunities and risks involved.

What history reveals about market corrections and crashes

The S&P 500's recent correction raises concerns about a bear market. History shows corrections are driven by high rates, unemployment, or global shocks, and that there's reason for optimism for nervous investors today. 

Howard Marks: the investing game has changed

The famed investor says the rapid switch from globalisation to trade wars is the biggest upheaval in the investing environment since World War Two. And a new world requires a different investment approach.

Welcome to Firstlinks Edition 605 with weekend update

Trump's tariffs and China's retaliatory strike have sent the Nasdaq into a bear market with the S&P 500 not far behind. What are the implications for the economy and markets, and what should investors do now? 

  • 3 April 2025

Designing a life, with money to spare

Are you living your life by default or by design? It strikes me that many people are doing the former and living according to others’ expectations of them, leading to poor choices including with their finances.

World's largest asset manager wants to revolutionise your portfolio

Larry Fink is one of the smartest people in the finance industry. In his latest shareholder letter, the Blackrock CEO outlines his quest to become the biggest player in private assets and upend investor portfolios.

Latest Updates

Investment strategies

An enlightened dividend path

While many chase high yields, true investment power lies in companies that steadily grow dividends. This strategy, rooted in patience and discipline, quietly compounds wealth and anchors investors through market turbulence.

Investment strategies

Don't let Trump derail your wealth creation plans

If you want to build wealth over the long-term, trying to guess the stock market's next move is generally a bad idea. In a month where this might be more tempting than ever, here is what you should focus on instead.

Economics

Pros and cons of Labor's home batteries scheme

Labor has announced a $2.3 billion Cheaper Home Batteries Program, aimed at slashing the cost of home batteries. The goal is to turbocharge battery uptake, though practical difficulties may prevent that happening.

Investment strategies

Will China's EV boom end in tears?

China's EV dominance is reshaping global auto markets - but with soaring tariffs, overcapacity, and rising scrutiny, the industry’s meteoric rise may face a turbulent road ahead. Can China maintain its lead - or will it stall?

Investment strategies

REITs: a haven in a Trumpian world?

Equity markets have been lashed by Trump's tariff policies, yet REITs have outperformed. Not only are they largely unaffected by tariffs, but they offer a unique combination of growth, sound fundamentals, and value.

Shares

Why Europe is back on the global investor map

European equities are surging ahead of the U.S this year, driven by strong earnings, undervaluation, and fiscal stimulus. With quality founder-led firms and a strengthening Euro, Europe may be the next global investment hotspot.

Chalmers' disingenuous budget claims

The Treasurer often touts a $207 billion improvement in Australia's financial position. A deeper look at the numbers reveals something less impressive, caused far more by commodity price surprises than policy.

Fixed interest

Duration: Friend or foe in a defensive allocation?

Duration is back. After years in the doghouse, shifting markets and higher yields are restoring its role as a reliable diversifier and income source - offering defensive strength in today’s uncertain environment.

Sponsors

Alliances

© 2025 Morningstar, Inc. All rights reserved.

Disclaimer
The data, research and opinions provided here are for information purposes; are not an offer to buy or sell a security; and are not warranted to be correct, complete or accurate. Morningstar, its affiliates, and third-party content providers are not responsible for any investment decisions, damages or losses resulting from, or related to, the data and analyses or their use. To the extent any content is general advice, it has been prepared for clients of Morningstar Australasia Pty Ltd (ABN: 95 090 665 544, AFSL: 240892), without reference to your financial objectives, situation or needs. For more information refer to our Financial Services Guide. You should consider the advice in light of these matters and if applicable, the relevant Product Disclosure Statement before making any decision to invest. Past performance does not necessarily indicate a financial product’s future performance. To obtain advice tailored to your situation, contact a professional financial adviser. Articles are current as at date of publication.
This website contains information and opinions provided by third parties. Inclusion of this information does not necessarily represent Morningstar’s positions, strategies or opinions and should not be considered an endorsement by Morningstar.