In our recently published 2023 Diversification Landscape report, we took a deep dive into how different asset classes performed in the past couple of years, how correlations between them have changed, and what those changes mean for investors and financial advisors trying to build well-diversified portfolios.
In contrast to most securities, which are typically traded on an exchange and valued according to rules established by financial regulators, private investments involve lending money to an endeavor for a dedicated period of time with the hope of (but no guarantee of) enticing future cash flows. In the case of venture capital, it means providing resources for the incubation and development of an idea into a durable business; the probability of failure is high but so, too, are the potential returns if the investment gains traction.
Private equity typically refers to a more developed version of venture capital, where early-stage investment in a company that eventually goes through an IPO on a stock exchange may result in attractive upside. Private credit is when investors loan directly to companies that want to avoid the broader capital markets, typically for more favorable covenants than would be available otherwise. Leveraged buyouts, real estate, and real assets—all of these also exist under the umbrella of private investments.
And as varied as these private investments are, they share a number of structural characteristics. The first is illiquidity. Once an investment is made, those assets are committed for a significant period of time (often years) before the expectation of a return, in theory giving the management team the space that it needs to make a go of the endeavor. The second is a high barrier to investment entry, given comparatively large commitment minimums and high fees relative to those of marketable public securities. The third is complex reporting. Private investments rely heavily on discretion when valuing assets, particularly in the early years when there isn’t a market precedent. The industry standard for private company valuation is an internal rate of return, or IRR, that is calculated on a delay and can be easily manipulated, rather than the absolute return easily derived for securities that must transparently mark to market daily.
As a whole, these defining structural characteristics mean that private investments aren’t scrutinized publicly and on a periodic schedule. Instead, they use built-in patience to give the investments the greatest probability of success. As a result, the pace and magnitude of returns differ from marketable public securities, and that contributes to a perception of portfolio diversification, but in practice, many of these private investments are simply leveraged versions of existing equity and fixed-income market dynamics.
Recent performance trends
With data beginning in 2016, the quarterly IRRs reported by PitchBook represent the general experience of each of these private investment sectors; other indexes cited represent quarterly total returns.
In the wake of the pandemic panic (first-quarter 2020), when the Morningstar US Market Index lost 20.61%, venture capital, private equity, and secondaries (a type of investment that purchases an existing interest in a company from a private equity company) also suffered losses, but they were much more modest at 1.1%, 8.1%, and 2.5%, respectively. Aided by their illiquid structures and delayed reporting, these results don’t as easily reflect of-the-moment market temperament in pricing. Then, as markets roared in 2021, those same investment sectors benefited from the accompanying euphoria and rock-bottom financing rates. The one-year trailing IRRs for all three private sectors exceeded 40% in nearly every quarter that calendar year (secondaries was the exception, with 19.6% in the first quarter); venture capital reached 72% in the second quarter of 2021. Still, private investments remain susceptible to general business sentiment, and as inflation indicators picked up and anxiety over rising rates took hold, results for the first two quarters of 2022 reflected greater valuation caution. First-quarter IRRs for private equity and secondaries were modestly positive, at 1.3% and 2.6%, but venture capital’s IRR lost 5.0%. Second-quarter IRRs were lower; secondaries eked out a positive 1.5%, but private equity and venture capital lost 2.4% and 8.2%, respectively.
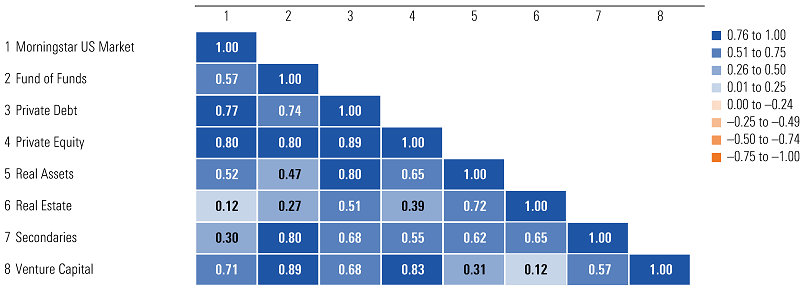
3-year correlation matrix: Private investments

Sources: PitchBook and Morningstar Direct. Correlations are based on internal rates of return for all but the Morningstar US Market Index, which is based on total returns. Quarterly data as of June 30, 2022.
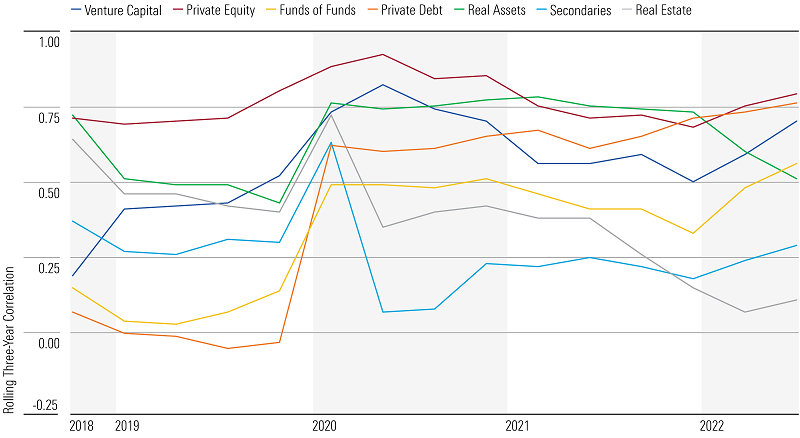
The rolling three-year correlations, reported quarterly, between the private investment sectors and the Morningstar US Market Index vary wildly and reflect volatility potential. By definition, many of these private sectors are early-stage equities. For example, the rolling three-year correlation of private equity ranged from 0.69 (at the end of 2021's bull market) to 0.93 (in the wake of the pandemic panic stress). Only private debt exhibited a negative rolling three-year correlation—in 2019's last two quarters—and that was extremely modest. From the first quarter of 2020 through the second quarter of 2022, the private debt correlations were in far greater sympathy with U.S. equities and ranged from 0.61 to 0.77.
Relative to other asset classes, the range of correlations across private investments differ dramatically from quarter to quarter, and rather than reflect reality, these are products of the structural characteristics of the asset class outlined above. Still, within private investments, venture capital and private equity are more correlated with marketable equities than private credit, and all three of these typically exhibit higher correlations to U.S. equities than real assets and real estate, which have strong niche underlying market factors that shape those markets.
Long-term trends
Over the long term, the structure of private investments means those revenue streams will look different from those of marketable securities, which more swiftly reflect adjustments to market sentiment in their pricing. This enhances diversification in a theoretical way, but investors who seek private options should remain alert to the risks unique to their underlying investment. Venture capital and private equity, for example, are leveraged and concentrated equity investments by their very structure. Through longer periods, the potential for those investments is tied to many of the same factors that lift and drag on public equity markets.
Rolling 3-year correlations vs. Morningstar US market index: Private investments

Sources: PitchBook and Morningstar Direct. Correlations are based on internal rates of return for all but the Morningstar US Market Index, which is based on total returns. Quarterly data as of June 30, 2022.
The quarterly rolling three-year correlations between these private investments and the Morningstar US Market Index have reached high points, unsurprisingly given that the investments are, by definition in many instances, equities. But these correlations can swiftly shift. For example, while private equity exhibited a 0.89 correlation with U.S. equities in the first quarter of 2020, that number declined to 0.69 by the last quarter of 2021.
Portfolio implications
While private investments remain a potential source for differentiated (though mostly delayed and leveraged) equitylike return streams, their structure merits caution for individual investors. The investment can easily fall apart without access to the highest-quality endeavours with well-resourced teams to manage those projects. This is potentially devastating given that the assets are committed for long periods of time with little recourse if something goes wrong. And while large institutional portfolios with unlimited time horizons and the ability to easily replenish funds may find private investments attractive, an individual investor without those benefits can more practically create diversification with other, more liquid and government-regulated asset classes.
Emory Zink is an associate director, global multi-asset and alternative funds, for Morningstar Research Services LLC, a wholly owned subsidiary of Morningstar, Inc. Firstlinks is owned by Morningstar. This article is general information and does not consider the circumstances of any investor. This article was originally published by Morningstar and has been edited slightly to suit an Australian audience.
Access data and research on over 40,000 securities through Morningstar Investor, as well as a portfolio manager integrated with Australia’s leading portfolio tracking service, Sharesight. Sign up to a free trial below:
Try Morningstar Investor for free