With the S&P 500 entering correction territory last week (a >10% fall), many investors are asking whether this will turn into something worse, such as a bear market (a >20% fall)? And given the U.S.’s dominance, perhaps a bear market for global shares?
As we show below for the S&P 500 (since the mid-1960s) and the Russell 2000 (since the late 1970s), there have been plenty of falls greater than 10% and 20%, with even the odd fall of more than 30% or 40%. The only fall greater than 50% during this period was the gut-wrenching GFC.
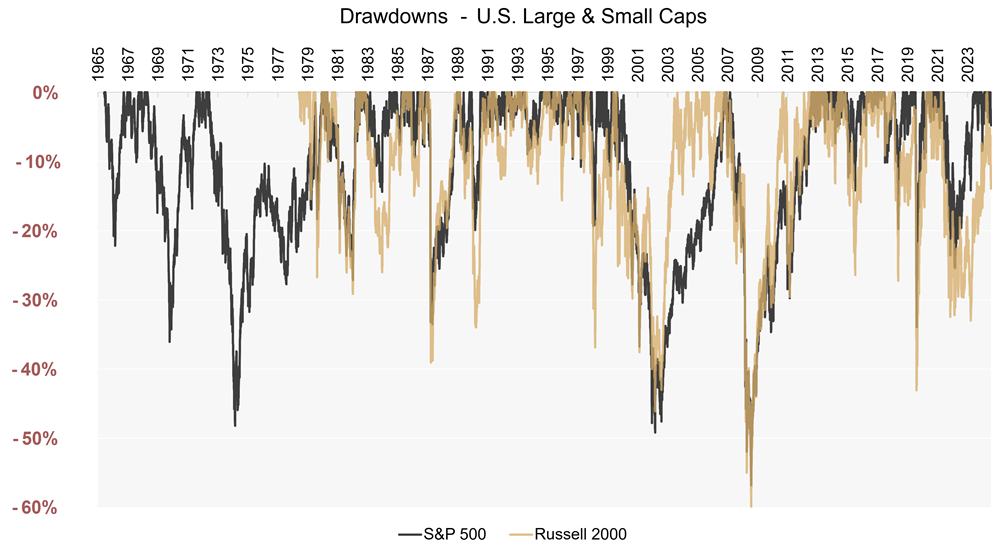
Source: Ophir. Bloomberg.
Many of the biggest drawdowns (peak-to-trough falls) were associated with U.S. recessions, including those in the early and mid-70s, the ‘81/82 recession, the ‘90/91 recession, the Dot.com Bubble with its early 2000s recession, and of course the 2008/09 GFC, as well as the brief Covid-19 recession in 2020.
The benefits of understanding corrections
Why care about understanding market corrections in the first place?
One obvious answer is: knowing what tends to cause corrections might help you avoid them. But, despite thousands of studies and books trying, it is very difficult, or perhaps even impossible, to identify corrections ahead of time with sufficient accuracy to be useful.
While you may not be able to time a correction by going into or out of cash, if you understand what causes corrections you can identify when you are in the ‘danger zone’; where a correction is more probable. You then may be able to mitigate some of the fall by skewing your portfolio to companies with stronger fundamentals and less risk.
Knowing what caused a correction can also help you can understand what will likely stabilise it and trigger a market rebound.
The three causes of corrections
In the table below our friends at Piper Sandler have categorised every U.S. share market correction greater than 10% going back to 1964. There have been 27 of them! Or about one every 2.2 years. (Get used to them long term investors!)
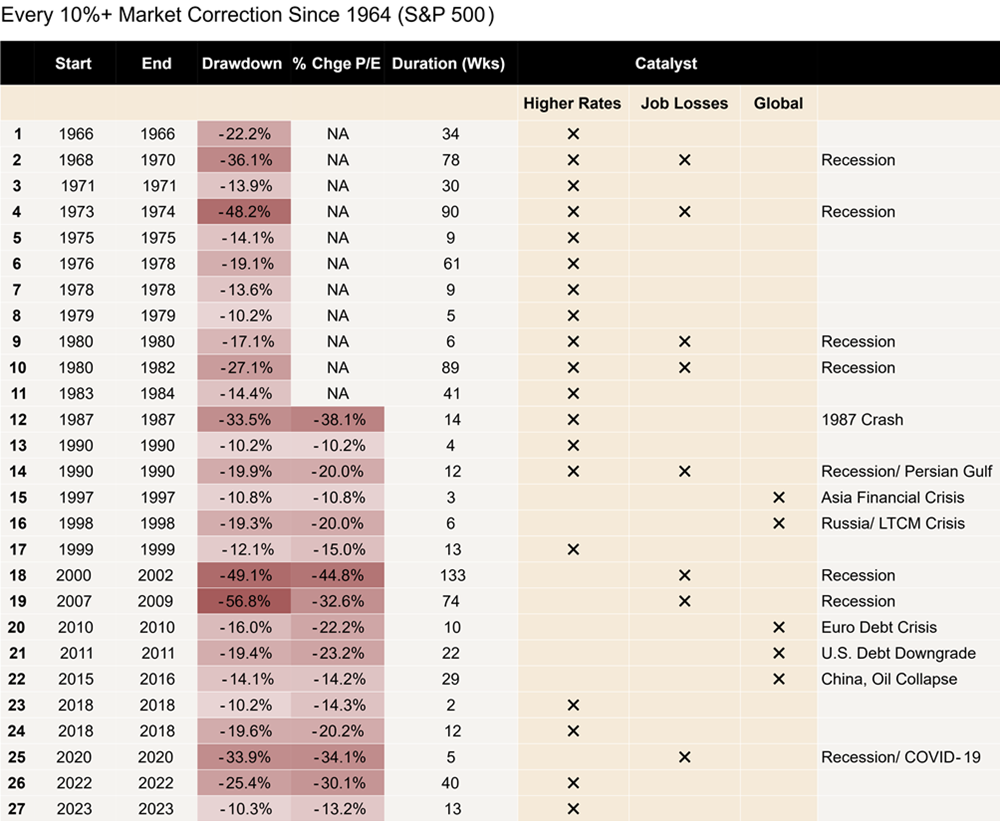
Source: Piper Sandler.
As you can see, most of the deepest falls are associated with recessions. The 1987 Crash, and the 2022 fall courtesy of the rapid hiking of interest rates by the U.S. Fed, are key exceptions.
Importantly, most corrections are driven overwhelmingly by valuations (price to earnings ratios) shrinking as risk aversion increases, rather than corporate earnings falling off a cliff.
Each correction can be grouped into three main causes:
- High interest rates
- Higher unemployment
- Exogenous global shocks (such as the Asian Financial Crisis or Euro Debt Crisis)
Of course, some of these can overlap and have other intertwined causes, but there is usually one of these three causes that stands out as the major reason the correction starts and ends.
History shows that not all correction causes are created equal
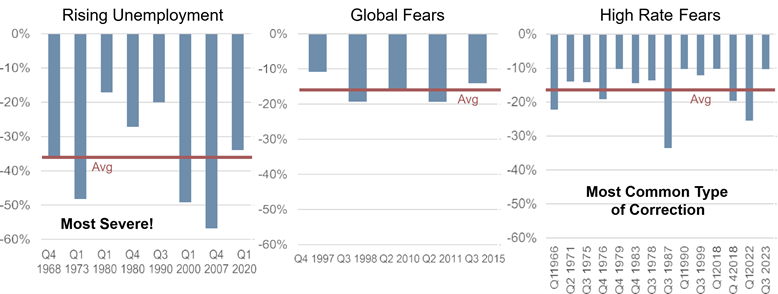
The most important insight history tells us is that the cause of the correction will go a long way to explaining how deep and long it is.
The six charts below are great ones to commit to any investor’s memory bank.
S&P 500 Drawdowns Peak to Trough
S&P 500 Drawdowns Duration (Weeks)
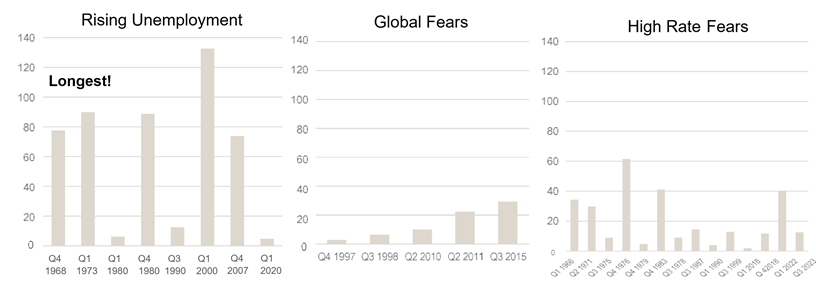
Source: Piper Sandler.
They tell us that:
- Higher rates have historically caused, and lower rates ended, the most corrections (52% of them), followed by higher unemployment (30%) and global shocks (18%). However, since inflation targeting was introduced in the U.S. in the 1990s, inflation and hence interest rates have been less volatile and caused fewer market corrections.
- Those corrections associated with job losses should be the most feared because they typically see the largest falls (-36% on average) and last the longest. This is probably because they are the most likely to see corporate earnings fall the most, alongside valuation falls.
- Those corrections based on exogenous global shocks tend to be the ‘best’, with similar average falls to those caused by higher rates (around -16%), but global shock corrections tend to be shorter lived.
While rising interest rates or unemployment might indicate a correction is ahead, getting the timing right is always difficult because markets are forward looking and the correction may begin when market participants EXPECT rates or unemployment to increase, before they actually do. It can still be useful though to understand the cause, because when rates or unemployment stabilise that can signal that the correction may be coming to an end, with a rebound to follow.
Almost by their very definition, exogenous global shocks are unpredictable, but at least their resolution can provide some guidance on what the market needs to see before it recovers.
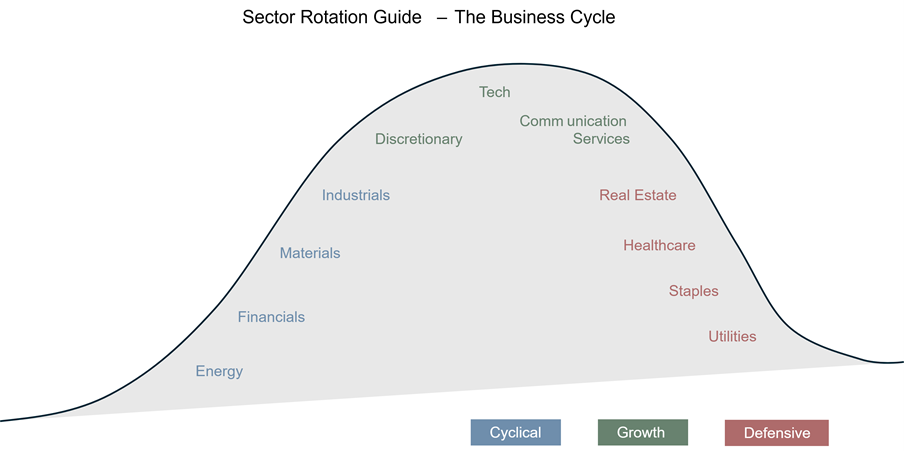
How different sectors perform in corrections
Perhaps the most useful part of this history lesson is understanding which parts of the market do better when staying invested during a market correction. (And staying invested will be the best outcome for most investors.)
Here the evidence is pretty clear, though not infallible. First, at a sector level, during a market correction the sectors that tend to perform better provide more stable, reliable and defensive revenue and earnings.
Which ones are they?
Typically, Real Estate, Health Care, Consumer Staples and Utilities.
Each has, on average, outperformed the U.S. share market as a whole during the 15 market corrections that we have data for going back to 1990.
Each also has an 80% or better ‘Hit Rate’ – that is, they have outperformed the market in at least 4 out of every 5 corrections.
What do these sectors have in common?
Their revenues and earnings tends to fluctuate less, generally because consumers don’t cut spending on them easily (everyone has to pay their utilities, grocery or doctors bills). They can therefore provide something that is prized in market uncertainty: more certain returns to their shareholders.
Source: Piper Sandler.
The type of stocks (‘factors’) that outperform in sell-offs
But investment ‘factors’ are better guideposts for investing during corrections than Sectors. (Factors is just a fancy investment term for common characteristics of different stocks.)
So, what are the best and worst factors during market corrections?
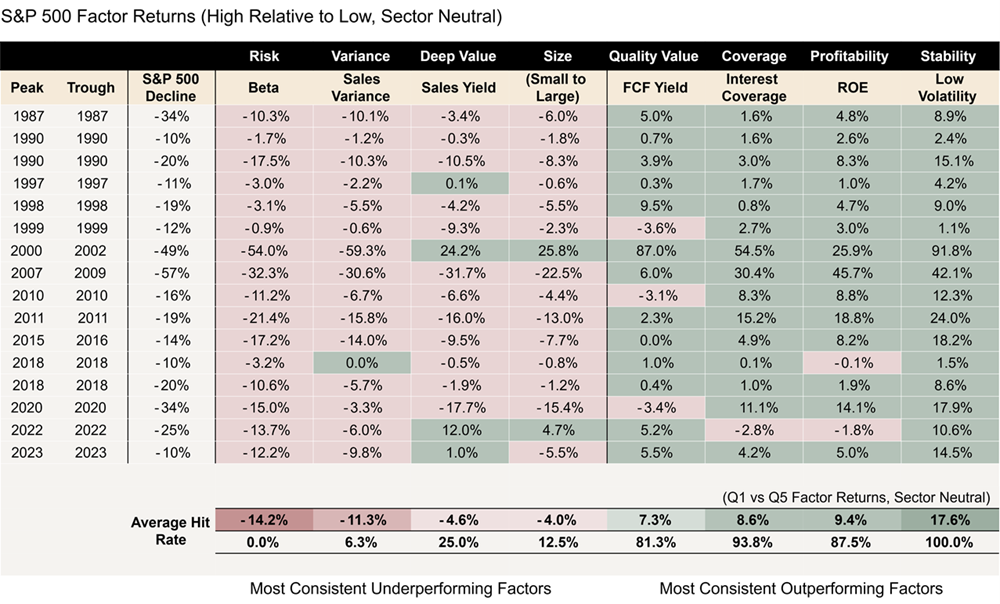
Source: Piper Sandler.
The table above shows that during corrections there are a few types of stocks that tend to underperform:
- Those with more volatile share prices compared to the market (so called higher Beta)
- Those with volatile revenues; and
- Smaller stocks.
By contrast, stocks with higher-quality cash flows, less debt and less volatile prices outperform.
It’s perhaps unsurprising that when markets are falling a lot, investors favour those businesses they can be more certain of their fundamentals and their share prices.
Important Point: While smaller companies tend to fall more during market corrections, the key exception to this in the table above is the 2000 to 2002 Dot.com-related market falls, where smaller companies significantly outperformed. This period shares some similarities to today where U.S. small caps have been the cheapest compared to large caps since the Dot.com Bubble. This was a key reason 25 years ago U.S. small caps fell less – they started from much cheaper valuations.
Where does that leave us today?
With the U.S. share market having already entered correction territory, it seems U.S. tariffs are the most likely cause of the drop and would fall in the ‘global exogenous shock’ bucket.
Neither interest rates nor unemployment has moved higher in the last few weeks to cause the sell-off. In fact, the most recent move in both short and long-term interest rates in the U.S. has been down.
It remains a risk, though, as tariffs are inflationary. So, it can’t yet be ruled out that the Fed may need to reverse course and hike rates as a result.
The U.S. unemployment rate has been moving up from its low in 2023, but this isn’t a new occurrence, and it is still near multi-decade lows.
If history is any guide this is good news because, as we’ve seen, exogenous shocks tend to see smaller market falls that recover more quickly.
Investors need to watch, however, that tariffs and policy uncertainty in general in the U.S. don’t morph into something more sinister like a recession, which would see job losses and a likely further fall in the share market. For now, though, this doesn’t seem the most likely outcome as the typical recession precursors like rising interest rates and lax credit conditions are absent.
Andrew Mitchell and Steven Ng are co-founders and Senior Portfolio Managers at Ophir Asset Management, a sponsor of Firstlinks. This article is general information and does not consider the circumstances of any investor.
Read more articles and papers from Ophir here.