Register For Our Mailing List

Register to receive our free weekly newsletter including editorials.

Home / 260

Opportunities across the capital structure

We highlighted in April 2018 in Cuffelinks how cheap the hybrids market looked, and the sector has since bounced back. Over the first 21 days of June, the Solactive ASX Hybrids Index, which is a market capitalisation-weighted benchmark of all listed subordinated bonds and hybrids, has risen 1.01% (or 101 basis points) compared to the RBA cash rate increase of 8 basis points.

Effects of new supply

A tsunami of $3.1 billion in new hybrid supply over February and March 2018, courtesy the Westpac and CBA issues (WBCPH and CBAPG), combined with Bill Shorten’s threats to remove cash rebates from franking credits, hammered the listed hybrid market down 1.49% over those months.

The market then bounced up 0.69% in April only to endure headwinds again in May after Macquarie launched an unexpectedly large $1 billion hybrid issue, which resulted in the sector suffering a 0.17% total return loss in that month.

By the end of May, major bank hybrids with five years left until final maturity (or call date) were paying franked spreads above the quarterly bank bill swap rate (BBSW) of 4.06%. This meant that total franked yields were as high as 6.6%, which compares favourably to the franked dividend yield on the ASX200 Index, which at the time was 5.44%. On an unfranked or cash basis, total yields at that time were a similarly chunky 4.9% on hybrids like CBAPD, which was above the 4.07% cash yield on the ASX200 Index despite the fact that hybrids have historically displayed one-quarter to one-third the volatility and downside risk of shares.

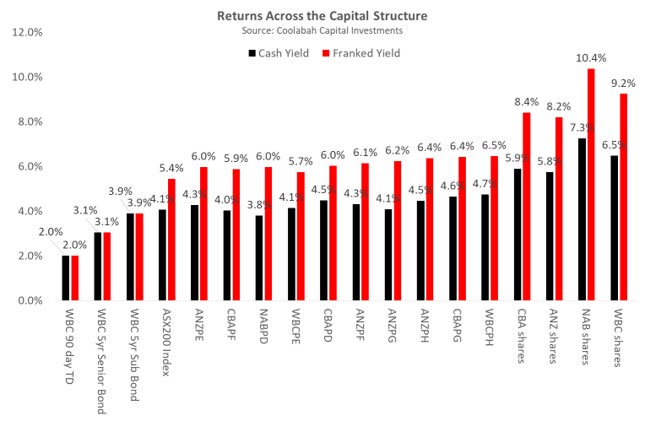
After the 1.01% total return over the first 21 days of June, where do valuations stand? The chart below shows the cash yields and franked yields on key ASX hybrids compared to the comparable yields on the ASX 200 index, and the major banks’ term deposits, senior bonds, subordinated bonds, and ordinary equities. This gives a sense of the returns available right across the capital structure with each sector obviously having different levels of risk.

Transfer of wealth from equity to bonds and hybrids

Since 2013, I’ve argued that the major banks needed to significantly deleverage their balance sheets, which they have done, reducing leverage from over 25 times six years ago to around 19 times today. This reduces their returns on equity, which have fallen from 17% to about 13% today. As the return on equity falls closer to their circa 11% cost of equity, the majors also have to trade much closer to book value, which is what has happened. Price to book value ratios have slumped from 3.0 times to around 1.5 times, in what should have been a direct transfer of wealth from the major banks’ equity holders to their bond and hybrid holders.

However, the surprising thing is, the much lower risks that the major banks carry today (as reflected by, amongst other things, vastly improved equity capital and liquidity coverage ratios), reinforced by the sale of risky non-core businesses, has yet to manifest in the form of tighter credit spreads, or a lower cost of debt capital.

At the end of 2006, CBA issued a 4-year senior bond at a 0.1% spread above BBSW that today would require spreads that are about eight times wider. In May 2007, CBA priced a lower-ranking subordinated bond with a 5-year call at just 0.24% above BBSW: similar bonds today trade six times wider.

CBA issued its PERLS IV hybrid in 2007 on a spread of 1.05% above BBSW, which is one-quarter of the spread CBA hybrids pay on the ASX today.

The investment thesis

In a world in which most assets, like equities and housing, remain very expensive by historical benchmarks (price/earnings multiples are above 2007 levels), these are pockets of opportunity.

Since the GFC was a financial credit crisis, the best value investments tend to be assets that were most adversely affected by this shock, such as the bonds and hybrids issued by banks and insurers, which are trading well wide of their 2007 levels in credit spread terms.


Christopher Joye is a Portfolio Manager with Coolabah Capital Investments, which invests in fixed income securities including those discussed by this article. This article does not address the individual circumstances of any investor.

  •   28 June 2018
  • 3
  •      
  •   
3 Comments
Fundie
June 28, 2018

Hybrids did quite nicely in the past couple of years (10% in 2016, 8% in 2017, including franking credits) – but that was mainly due to credit spreads declining since Feb 2016 (ie that saw prices rising from discount to premium).

Now spreads are rising, YTD total returns including franking credits (when you get them back next year and then re-investment them if you remember) is just 1.1% for the half year!

Ramani
June 28, 2018

The neither 'equity-fish nor debt-fowl' nature of hybrids, their perpetual nature solely at the issuer's option, instant convertibility by way of loss absorption into equity precisely it is worthless: these risks have been known from inception. However, the recent market turmoils, yields ticking up and closer to home, the consumer knee-capping by financial intermediation that makes the HQ relocate to Sicily have rightly spooked the investors.

Richard Murphy
June 28, 2018

Thanks Chris, informative as always. An aspect I've always found interesting is what is the relationship between equity volatility and hybrid volatility? Is it reasonably constant or does it vary significantly depending on circumstances?

If you measured this from 2004-2007 when total returns from both hybrids and senior corporate bonds looked very similar indeed, you might find hybrid volatility was even lower relative to equities than the 1/4 of equity vol you note. I.e., hybrids behaved more like bonds in circumstances where equities were really firing on all cylinders pre-GFC.

And no doubt the same might be true if you looked at historical performance since q2 2016 when equities were again firing. But when equities have very significant downturns like 2008, the hybrid-equity volatility relationship seems to change significantly and quickly, as the probability increases that some hybrid features could potentially come into play (call date deferral, div garnishing or deferral etc). The general correlation suddenly went from correlated with bonds 04-07 to correlated to equities in the worst days of 2008.

So is this relationship between equity and hybrids able to be explained by saying its 25-30% of equities, which no doubt it was over the historical period measured (we measured it between 2000 to 2015 and found it was closer to 50% curtesy of course of the GFC downturn). It is what it is historically, but what about as a guide to the future?

Or ultimately, is the answer re future expectations - it depends on what's going to happen with equities? If it's plain sailing for equities, then likely low vol. and correlation for hybrids. If a significant equity downturn awaits at some stage between 2018 to 2020, will hybrids still demonstrate 25-35% of equity vol., or will it be higher depending on how bad the equity downturn is? I.e., hybrids behave like bonds when all's well with equities, but more like equities if it all goes to custard. Feels like strong defenders when your strikers are scoring lots of goals, who fall over when you're under attack. Apologies for lame WC analogy.


Leave a Comment:

RELATED ARTICLES

Turbulence creates opportunities for bonds and hybrids

Why bank hybrids are far too expensive

The best income-generating assets for your portfolio

banner

Most viewed in recent weeks

3 ways to fix Australia’s affordability crisis

Our cost-of-living pressures go beyond the RBA: surging house prices, excessive migration, and expanding government programs, including the NDIS, are fuelling inflation, demanding bold, structural solutions.

Making sense of record high markets as the world catches fire

The post-World War Two economic system is unravelling, leading to huge shifts in currency, bond and commodity markets, yet stocks seem oblivious to the chaos. This looks to history as a guide for what’s next.

Is there a better way to reform the CGT discount?

The capital gains tax discount is under review, but debate should go beyond its size. Its original purpose, design flaws and distortions suggest Australia could adopt a better, more targeted approach.

How cutting the CGT discount could help rebalance housing market

A more rational taxation system that supports home ownership but discourages asset speculation could provide greater financial support to first home buyers.

Welcome to Firstlinks Edition 648 with weekend update

This is my last edition as Editor of Firstlinks. I’m moving onto a new role though the newsletter will remain in good hands until my permanent replacement is found.

  • 5 February 2026

It’s economic reality, not fear-based momentum, driving gold higher

Most commentary on gold's recent record highs focus on it being the product of fear or speculative momentum. That's ignoring the deeper structural drivers at play. 

Latest Updates

Superannuation

Super is catching up, but ageing is a triple-threat

An ageing Australia is shifting the superannuation system’s focus from accumulation to the lifecycle of retirement. While these pressures have been anticipated for decades, they are now converging at scale and driving widespread industry change.

Investment strategies

Corporate earnings show resilience against volatility but risks remain

Evidence for a strong reporting season had been piling up for months and validated an upgrade cycle already underway. However, risks remain from policy uncertainty.

Superannuation

Want your loved ones to inherit your super? You can’t afford to skip this one step

One in five Australians die before retirement and most have not set up their super properly so their loved ones can benefit from all their hard work and savings. 

SMSF strategies

Sixteen steps in a typical SMSF borrowing

Getting a mortgage is never an easy process but when an investment property is purchased in a SMSF the complexity increases significantly. Read this before taking the plunge. 

Planning

Do HNWI get better advice?

Good advisers lead to more diversification, lower turnover and less home bias. However, studies show the average adviser may not be adding much value to clients. 

Strategy

AFL Final Ten with wildcard edit 'unlevels' the field

When the new AFL season kicks off a wild-card will be added to the finals. Is this new formula fair and how does it impact the odds of winning the premiership.

Planning

Love them or hate them, it's worth understanding annuities

Investors have historically balked at exchanging a lump sum for a future steam of income. Breaking down the financial and emotional considerations of purchasing an annuity.        

Sponsors

Alliances

© 2026 Morningstar, Inc. All rights reserved.

Disclaimer
The data, research and opinions provided here are for information purposes; are not an offer to buy or sell a security; and are not warranted to be correct, complete or accurate. Morningstar, its affiliates, and third-party content providers are not responsible for any investment decisions, damages or losses resulting from, or related to, the data and analyses or their use. To the extent any content is general advice, it has been prepared for clients of Morningstar Australasia Pty Ltd (ABN: 95 090 665 544, AFSL: 240892), without reference to your financial objectives, situation or needs. For more information refer to our Financial Services Guide. You should consider the advice in light of these matters and if applicable, the relevant Product Disclosure Statement before making any decision to invest. Past performance does not necessarily indicate a financial product’s future performance. To obtain advice tailored to your situation, contact a professional financial adviser. Articles are current as at date of publication.
This website contains information and opinions provided by third parties. Inclusion of this information does not necessarily represent Morningstar’s positions, strategies or opinions and should not be considered an endorsement by Morningstar.