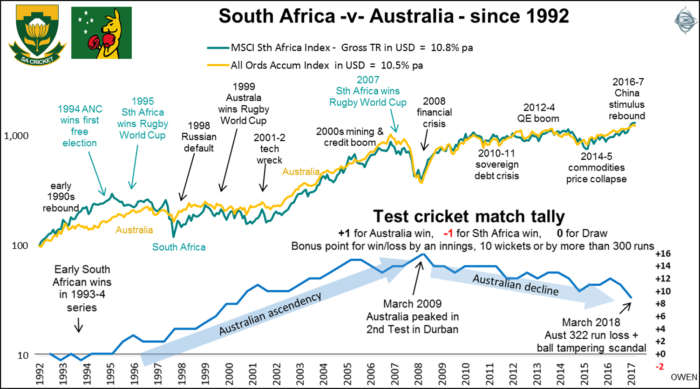
The only topic to capture more headlines in the past week than Trump’s trade wars has been the Australia - South Africa cricket test series – for all the wrong reasons. Even Trevor Chappell has said he is relieved that after 37 years he is no longer the most hated man in Australian sport. Let's take a different angle by looking at the stock market performance of the two countries.
Dependence on commodities
Australia and South Africa are both commodities-based economies with stock markets dominated by mining explorers and producers. The chart shows total returns (including dividends reinvested) from the broad stock market index in each country, expressed in US dollars to show them in a common currency and starting from a common base from 1993 when South Africa re-joined the world following the end of Apartheid.
Both markets are highly cyclical and reliant on commodities prices and foreign ‘hot money’ capital flows driven by global sentiment. South African shares have done much better in local currency terms (averaging 15% pa in Rand versus 10% for the ASX in Aussie dollars) but returns in US dollar terms have been virtually the same and have followed the same path.

Click to enlarge
South Africa got off to a flying start as foreign money rushed into the newly minted ‘emerging market’ in the early 1990s, but then foreign capital fled in the 1997 Asian currency crisis and especially in the 1998 Russian default crisis. Both had a mild ‘dot com’ boom and tech wreck, but both had a huge 2003-07 China-led commodities boom and subsequent GFC bust. They fell together in the 2015 commodities price collapse and then rose together in the 2016-07 China-led rebound.
The chart reminds us that share prices are driven more by global cycles than local issues.
What about the cricket?
The lower section shows the test cricket match tally between the two countries since South Africa rejoined the sporting world in 1993. We have played a total of 97 matches in 26 series since 1902. Australia is winning the match tally with 52 match wins, and also the series tally with 16 series wins. Here we focus on the post-Apartheid era.
The blue line shows a running tally of test match wins and losses as +1 for an Australian win, -1 for a South African win, and a bonus +1 or -1 point for a win or loss by an innings, 10 wickets or by more than 300 runs. After a couple of early wins by South Africa in the Nelson Mandella-inspired post-Apartheid euphoria, Australia gained the ascendency from the late 1990s to the late 2000s under Taylor, Waugh and Ponting. Australia peaked with a 175 run win in the Second Test at Durban in 2007 with two centuries by opener Phil Hughes (the youngest ever player to achieve this, at age 20, on his debut tour).
That match started on 6 March 2009, the same day the stock market reached its lowest point in the GFC. That day was the turnaround for shares rebounding out of the GFC but it was also the start of a long relative decline in Australian cricket. If the cricket scandal represents the all-time low for Australia, what omens does it offer for stock markets? The road out for Australian cricket surely starts now.
Ashley Owen is Chief Investment Officer at advisory firm Stanford Brown and The Lunar Group. He is also a Director of Third Link Investment Managers, a fund that supports Australian charities. This article is general information that does not consider the circumstances of any individual.