Infrastructure is often seen as an alternative to low risk defensive assets like cash and government fixed income in investors’ portfolios. In discussions with infrastructure investors over the past few months, one recurring discussion topic has been the extremely low level of base or risk free interest rates.
Why does it matter?
Part of the attraction of infrastructure at the moment and the record high prices of recent Australian core infrastructure transactions (and the gnashing of teeth amongst infrastructure investors at the cancellation of the former Newman Government asset sales programme) is that returns to traditional low risk sources of yield are so low.
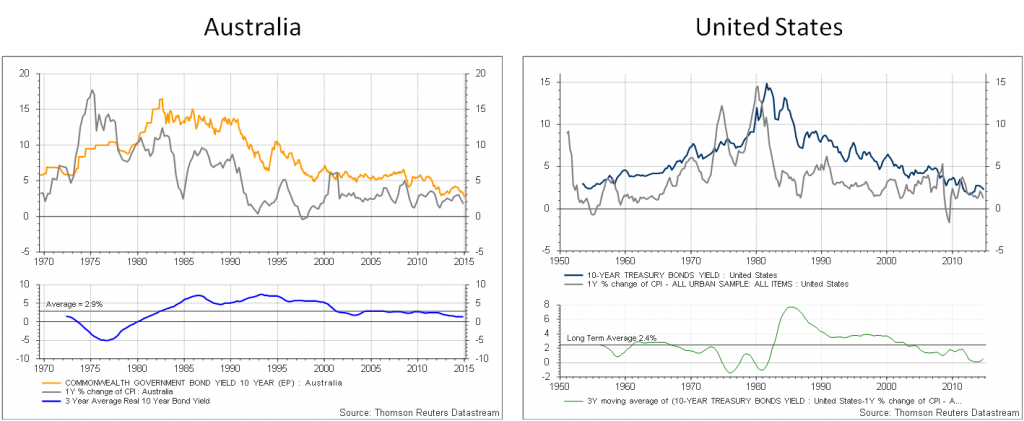
The chart below shows the long term history of Australian 10 year government bond rates. Current yields of 2.5% are the lowest in the history I have been able to access (since 1969). This implies a zero real return (assuming inflation keeps within the 2-3% target band set by the RBA) before tax and fees. Post tax returns for superannuation investors will be negative, an unappetising prospect.
But will such low real base rates persist or go even lower, and how should portfolios be managed in light of low interest rates?
A long term outlook for interest rates
I am not going to make any short term forecast on bond rates. Current forward interest rate markets are probably as good a guess as anyone’s on what might happen in the short term. And in any case, most infrastructure investors are considering investments that last decades and so decisions don’t turn on the short term path for rates.
The more interesting question is the longer term – what do we think interest rates will do over the next 10 or 20 years? Are the rates a structural shift (and the high real rates enjoyed by investors over the past 20-30 years are actually unusual) or should we expect, once the short term impact of recovering from the GFC and QE work their way out of the system, that markets will return to ‘normal’?
Economic theory suggests that in the long term, growth in the economy should match nominal bond rates. The charts below illustrate these relationships for both Australia and the United States (note the different time scales).
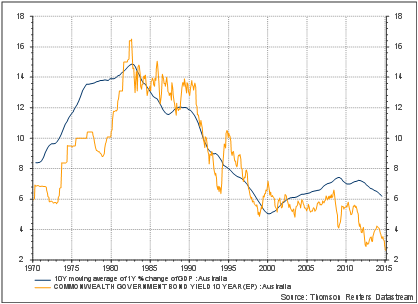
Australian 10 Year Bond Rates versus Nominal GDP Growth
United States 10 Year Bond Rates versus Nominal GDP Growth
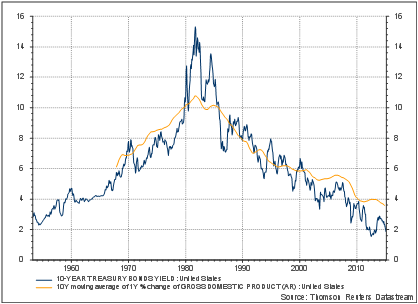
These charts show the relationship works pretty well – albeit recently both countries have had significantly lower bond rates than nominal GDP growth. In Australia, nominal GDP growth has been running at over 6% for the past decade, which is basically a mining boom/terms of trade story.
If you accept this relationship, future real GDP growth in Australia is likely to be significantly lower than over the past couple of decades. Australia won’t benefit from another mining boom. Population growth will be slower. There won’t be the same benefit from increased female participation in the workforce. The following chart, extracted from a speech by Martin Parkinson last year, gives an interesting decomposition of these effects.
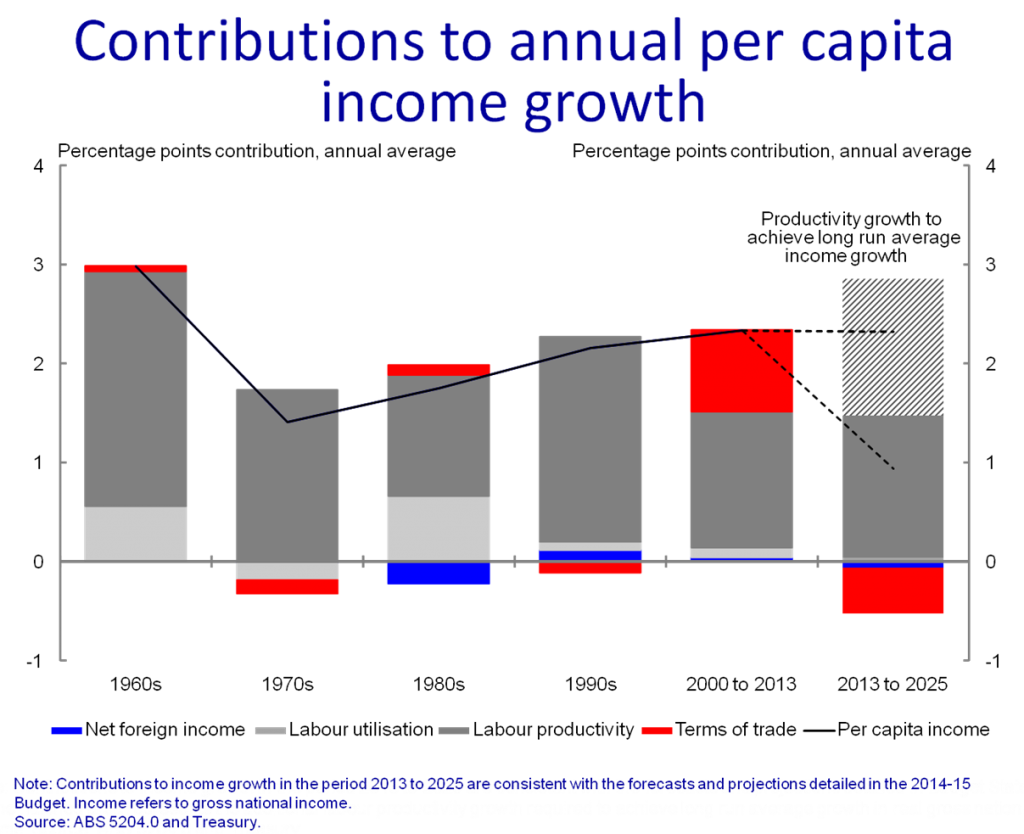
My view is that real GDP growth will be weaker, in the 2%-3% range, rather than the 3%-4% which has been ‘normal’ for Australia over the past few decades. A key risk to this is productivity growth which could easily disappoint.
Adding to this is inflation, which will probably track at 2-3% with a continued reversal of the mining boom terms of trade effect. This suggests a 4%-5% nominal GDP growth rate and by implication bond rate. This would be a real bond rate in the 2%-3% range, significantly higher than rates today.
In the US both growth (probably 1.5%-2.5% real) and inflation (1-2%) will be lower suggesting a lower US 10 year bond rate in the 2%-3% range. And this isn’t that controversial – US bond markets currently have a forward interest rate of around 2.5% from about 2020 onwards. It just takes a while to get there from current zero rates!
It is in Australia where the gap between market views (which has cash rates getting back up to 3% in 2021 and basically tracking in the low 3% range from there) and the outlook for nominal GDP is most stark. To reconcile the two would require either much weaker expectations of economic growth or inflation.
The one factor, which is important, but doesn’t figure in a nominal GDP growth based analysis is the high level of debt across the world at present. Debt, except when invested in productive capacity, is future consumption brought forward. The current debt overhang will be a drag on growth for a substantial period ahead. This, directly or indirectly, will be a cap on sharp rises in interest rates as many parts of the world cannot afford higher interest rates. All this suggests to me that the path for rates might be somewhat lower than a raw analysis of nominal GDP growth would suggest.
What does that mean for infrastructure investors?
Infrastructure is a long duration asset. A material share of the strong performance of infrastructure over the last decade is attributable to declining bond rates. If rates rise over the medium term, then necessarily this will be a drag on the future performance of infrastructure assets from today’s valuations. An exception to this is floating rate infrastructure debt.
Look under the hood. Interest rates have direct and indirect impacts on infrastructure valuations. Much of the focus has been on target equity returns and multiples. However, it is important to recognise that base rates have material impacts through the cash flow impact of debt costs.
While many investors talk of their ‘discipline’ in not reducing target equity returns in light of lower base rates, the reality is that their investment bankers (and managers) forecast the cost of debt service using market implied interest rates. This creates a substantial inconsistency between a static equity hurdle and equity return forecasts that include the benefit of cheap debt service costs.
Be consistent. Whatever your view on base rates is, you should be consistent in terms of forecasts for inflation and, for patronage or economic infrastructure assets, revenue projections. In a world where bond rates remain low it seems highly likely that inflation and economic growth outcomes will be much lower than history. A follow-on question for another day is whether low interest rates ‘justify’ the record earnings multiples for recent Australian core infrastructure transactions.
Alexander Austin is Chief Executive Officer of Infradebt, a specialist infrastructure debt fund manager. This article provides general information and does not constitute personal advice.