In Part 1, we looked at the record of Labor (or left-leaning) and Liberal (or right-leaning) governments in running government surpluses or deficits. Both sides have run few government surpluses since Federation, and Labor ran more frequent and larger deficits than Liberal governments.
This week we focus on the lower section of Chart 1, showing Commonwealth government debt as a per cent of GDP (Gross Domestic Product, or national output, income and expenditure).
Chart 1: Federal government deficits and debt since Federation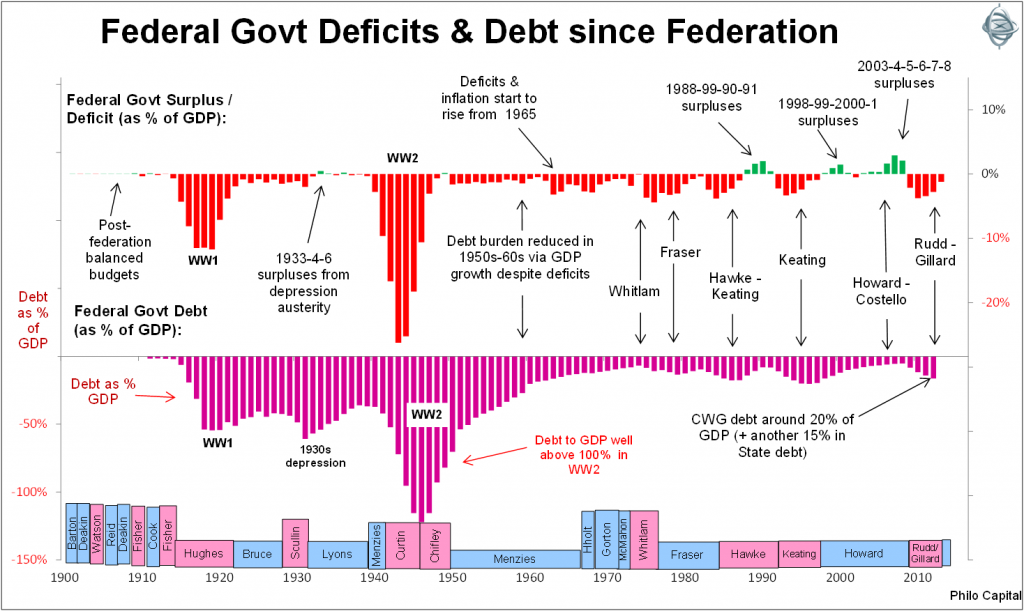
Funding the war efforts
The main debt build-ups were caused by the massive deficit spending war efforts in the two World Wars. Both happened to be on Labor’s watch, but both were bi-partisan, and so should not be attributed to Labor profligacy.
The debt-to-GDP ratio also increased during the 1930s depression, but it was not due to deficit spending. Between 1929 and 1932 the nominal level of debt was actually reduced by 15% but the level of national income (GDP) contracted by even more, a staggering 31% (half of which was due to a real GDP contraction and the other half price deflation in the depression), so the debt to GDP ratio increased even though the amount of debt fell.
Australia did not adopt a Keynesian deficit spending spree during the 1930s depression like the US because we simply were not able to. The Commonwealth and state governments had run out of credit in foreign debt markets by 1929, and the government’s then wholly-owned Commonwealth Bank refused to lend it more money. The only option was to stick to the savage and deflationary austerity of the 1931 ‘Premiers’ Plan’ and force all holders of domestic government debt into a 22.5% haircut restructure deal (a-la the Greek restructure in the recent European sovereign debt crisis).
Much like the Abbott Liberal Government today, the break-away United Australia Party won the 1931 election on promises to abandon Labor’s austerity plan but, immediately after being elected, ditched those promises, endorsed Labor’s austerity plan and cut spending savagely. The difference was that in 1931 nobody would lend to Australia. The spending cuts, together with interest savings from the debt restructure ‘haircut’, resulted in three government surpluses - in 1933, 1934 and 1936. These can be seen in the top section of Chart 1 above.
Current level of government debt
Chart 1 also shows that the recent Rudd/Gillard deficits were similar in scale to the Fraser, Hawke and Keating deficit eras. Contrary to popular myth the Whitlam era was not one of high deficits or high debt. The only significant deficit was in 1975, with the budget crisis triggering the controversial sacking of the Whitlam government by Governor General Sir John Kerr on behalf of the Queen.
How does Australia compare?
Chart 2 shows how Australia’s level of government debt compares with the rest of the world.
Chart 2: Government Debt to GDP ratios
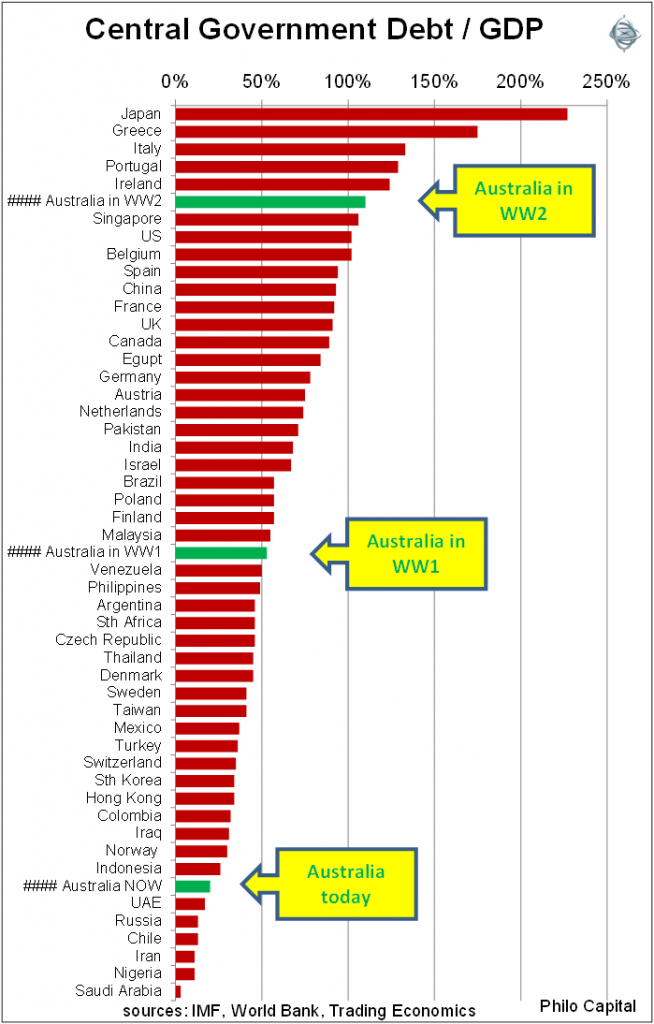
Here we see that even after the post-GFC debt build-up caused by borrowing to fund the Rudd/Gillard deficits, Australia’s current level of government debt is very low relative to almost all other countries. Even Australia’s war-time debt levels were lower than several countries today – notably Japan and the ‘PIIGS’. We reduced our debt levels over time by growing the economy, not by ‘paying it off’, and so can they.
Debt servicing levels (interest paid to service government debt)
Chart 3 shows the interest burden of the government debt, expressed in terms of interest cost as a percentage of GDP and also interest cost as a percentage of government receipts (mainly tax revenues).
Chart 3: Federal government debt and interest burden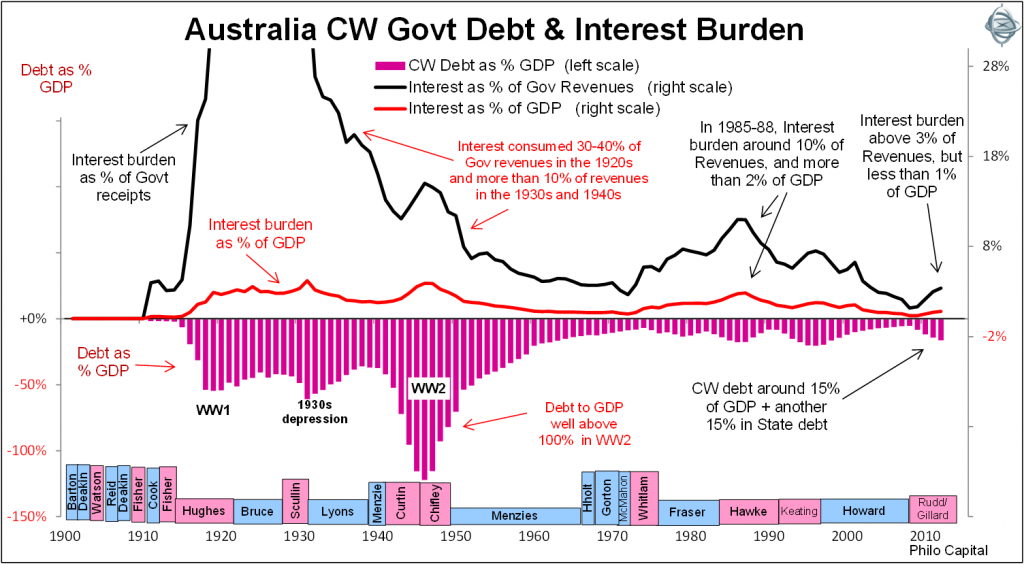
Interest payments on Federal government debt consumed 30-40% of all Federal government revenues in the 1920s (on a par with the European ‘PIIGS’ and Japan today). Interest was still consuming more than 10% of revenues in the 1930s and 1940s (on a par with the US today). The interest burden was then brought down in the post-war boom in the 1950s and 1960s.
Paying off the debt
The debt service burden relative to national income (shown as the red line in Chart 3) was brought down from its astronomical levels in World War 2 primarily by growing the size the national economy rather than reducing the absolute level of debt, which continued to rise in dollar terms.
In recent years, the interest burden of government debt was at its lowest level ever in 2007-2008, when the level of debt was also at its lowest, but interest costs and debt levels have risen sharply since 2008.
However, Australia’s interest burden in recent years (at around 1% of GDP and 3-4% of tax receipts) is no higher than it was in the 1950s to the 1970s. This is partly due to the relatively low level of debt, and also partly due to the relatively low interest rates today.
Some conclusions
- The current level of Commonwealth government debt relative to national income is modest, and is lower than almost any other time since World War 1. It is also lower than almost all other countries in the world today. The only times it was lower than today’s levels was in the late 1960s to mid-1970s, and in the late 1980s.
- Current interest burden on Commonwealth debt (as a % of national income and also as a % of government receipts) is also very modest, and is lower than almost any other time since before World War 1. World War funding was bi-partisan.
- Although market yields on government bonds have been rising since July 2012 from their ultra-low post-GFC levels, rising bond yields don’t translate into higher interest payments on the bonds until each bond series matures and is re-financed, which in many cases is more than a decade into the future. Hence the government’s recent shift to longer bond maturities in order to lock in lower interest rates for longer.
- Governments generally do not reduce debt levels by ‘paying off debt’ per se, but instead the size of the economy grows and that reduces the ratio of debt to national income. The two occasions when governments did actually pay off debt with government surpluses were in the 1930s depression (under Labor) and in the late 1990s to 2000s (under Liberal).
In Part 3, we will look at what really matters to investors - the impact of government deficits and surpluses on stock market returns, under Labor and Liberal governments.
Ashley Owen is Joint CEO of Philo Capital Advisers and a director and adviser to the Third Link Growth Fund.