It’s been just over three months since the gold price traded at all-time highs in nominal terms, hitting US$2,067 per troy ounce on 6 August 2020.
Despite the many tailwinds that drove the gold price to that level, an examination of market history suggested there was too much investor exuberance on the long side of trade at the time and that a period of consolidation was required.
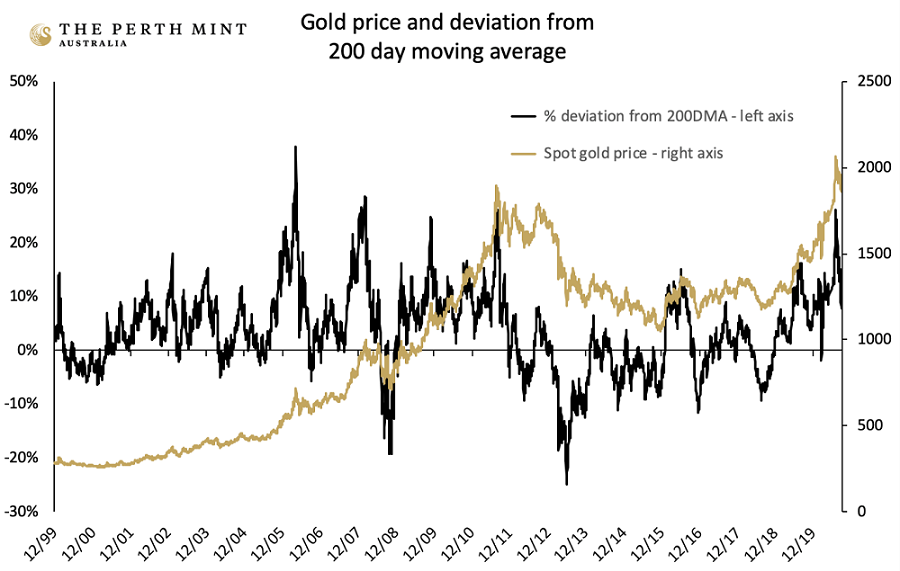
This is evident in the chart below, which plots both the USD spot price of gold and how far the spot price was trading above or below its 200-day moving average (200DMA) on any given day. Data covers from the end of 1999 through to the end of September 2020.
Source: The Perth Mint, Reuters
The chart highlights that there have been several occasions in the past 20 years (in 2006, 2008, 2009 and 2011) when the gold spot price was trading at 20% or more above its 200DMA, which is where it sat in early August of this year.
On each prior occasion that the market ran this hot, it was soon followed by a period of consolidation, declining in the following three months by an average of approximately 10%.
Almost exactly the same thing has happened again this time around. In what was, in many ways, a textbook correction leading into the early November US Presidential election, gold ended October 2020 trading at USD 1,881.90 per troy ounce, 9% below the August 2020 all-time high.
Gold and US Presidential elections
The gold price rallied in the days after voting closed for the 2020 US Presidential election, trading at more than USD 1,950 per troy ounce late last week, up more than 3% from the October close. This proved short lived, with the precious metal falling close to USD 100 per troy ounce on news Pfizer may have successfully developed a COVID-19 vaccine.
As for what happens next, a review of the performance of gold in the aftermath of prior US Presidential elections is one (admittedly imperfect) way of getting a feel for how the precious metal may perform in the period ahead.
Our own analysis based on market movements in the aftermath of every US Presidential election since 1968 suggests that the gold price has on average risen by 5.58% in the year after each election.
There is however a wide disparity within the one-year figures, with a best result of +51.83% (after the 1972 election), while the worst result saw gold deliver a return of -32.67% (following the 1980 election).
The table below highlights the average, the best and the worst returns over one, three and five years for the USD gold price in the aftermath of every US Presidential election since 1968.
|
Gold price returns
|
|
Timeframe
|
Average return
|
Best return
|
Worst return
|
|
1 year
|
5.58%
|
51.83%
|
-32.67%
|
|
3 years
|
42.99%
|
203.42%
|
-40.52%
|
|
5 years
|
81.66%
|
342.31%
|
-49.16%
|
Source: The Perth Mint, Reuters
State Street global advisors also analysed the performance of gold in various US political environments. Rather than look at one, three and five year returns in the aftermath of each election, they instead looked at average annual returns for gold based not only on which party occupied the White House, but who controlled the US Congress.
The results are displayed below.
|
|
Party in control
|
Average annual return (%)
|
|
Presidency
|
Democrat
|
11.2
|
|
Presidency
|
Republican
|
10.2
|
|
Congress
|
Democrat
|
20.9
|
|
Congress
|
Republican
|
3.9
|
Source: State Street Global Advisors
The data suggests that whoever occupies the White House has little to no material impact on gold price returns. The table shows that the gold price delivered annual average gains of 11.2% under Democratic Presidents and 10.2% under Republican Presidents.
The data instead indicates that it is far more important who controls the US Congress. The gold price has historically risen by more than 20% per annum under a Democrat-controlled US Congress, in comparison to an increase of just 3.9% under a Republican-controlled US Congress.
Interestingly, the worst environment for gold has been when the US Congress isn’t controlled by either party. In such environments, the gold price only saw average annual increases of 3.5%.
Ignore the election noise
While the above analysis provides some interesting insights, it is no guarantee of what will transpire in the years to come.
As such, we think investors are better served focusing on the other macroeconomic, monetary and market forces that may impact their portfolios going forward. In doing so, we believe many will conclude that irrespective of the US political environment, there are multiple factors supporting gold and the role it can play in a portfolio.
Monetary policy remains a key tailwind, with the decision last week by the Reserve Bank of Australia to cut interest rates, target lower bond yields and launch an AUD 100 billion Quantitative Easing program an illustration of how much easy money will be injected into the financial system in the years to come.
Real rates on cash and much of the fixed income universe will remain negative for years to come.
Gold should also be supported by investors looking to hedge against equity market risk, which remains high. This is driven by multiple factors, including:
- The continued threat posed by COVID-19, the spread of which has worsened in developed market economies in the Northern Hemisphere over the past month. Pfizer’s news about a vaccine is a welcome development, but it’s not an immediate cure to the pandemic.
- Equity market valuations, which remain stretched by historical standards.
- Potential for ongoing political gridlock in Washington.
Trade tensions are also likely to remain, even if the rhetoric is dialled down with a change in the White House. These ongoing pressures, coupled with the supply chain concerns posed by COVID-19, suggest that inflationary risks may be more apparent than the market is currently anticipating, despite the very real demand deficit that exists in the global economy today.
Jordan Eliseo is Manager of Listed Products and Investment Research at The Perth Mint, a sponsor of Firstlinks. The information in this article and the links provided are for general information only and should not be taken as constituting professional advice from The Perth Mint. You should consider seeking independent financial advice to check how the information in this article relates to your unique circumstances.
For more articles and papers from The Perth Mint, click here.