Australian Foundation Investment Company (AFIC) is the largest Listed Investment Company (LIC) or Trust (LIT) on the ASX (ASX:AFI), with a market cap of around $9 billion. It’s also the most liquid and oldest (listed in 1936!).
The fund has an enviable, very-long-term outperformance track record.
Since the late 1980s, AFIC has traded on an average premium to Net Tangible Assets (NTA) of +1.8%. That premium reached nearly +20% in 2022.
Yet AFIC now trades at a 7-7.5% discount to NTA, putting it in the lowest 5-10% of its discount-premium range in AFIC’s history.
So, what gives? Why such a historically big discount? And what does that mean for the outlook for other listed funds?
An alternative explanation
Investors give several reasons for LIC/LIT premiums and discounts, including:
- Supply and demand
- Size of the LIC or LIT
- Liquidity of the fund
- Investor sentiment
- Market direction
- Investment performance
But so many of these reasons fail to explain AFIC’s historically large discount.
AFIC is a large, liquid fund, with good recent one- and five-year performance. The Australian large-cap-dominated index (ASX200) is within a whisker of all-time highs, so we have a fairly bullish market.
What else could explain AFIC’s historically high discount?
We think it’s interest rates.
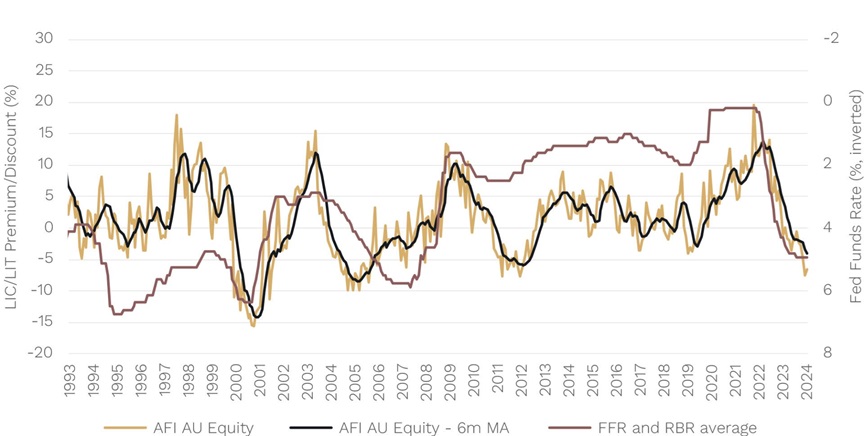
Below, you can see the premium and discount of AFIC on a monthly (orange line), and six-month moving average basis (black line), since the early 1990s.
We have added a red line, which is the average of the US Federal Reserve’s Fed Fund Rate and the Reserve Bank of Australia’s Cash Rate, inverted.
Chart 1: LIC/LIT premiums/discounts move with rate hikes/cuts

Source: Bloomberg
It’s clear: lower interest rates (a higher red line) have been associated with higher premiums to NTA … and higher interest rates (a lower red line) have been associated with higher discounts to NTA.
Managing OPH’s big discount
Our Ophir High Conviction Fund (ASX:OPH) has been listed on the ASX as a LIT since late 2018.
It has traded as high as a +20% premium, and as low as an -18% discount to NTA. Overall, it has traded close to par with an average discount of -2.2%.
However, like AFIC, it currently trades at a larger-than-average discount, in OPH’s case circa -11% at writing.
We, of course, are working hard to help manage the discount, including:
- Enhanced marketing to make investors aware of the value on offer to investors if they buy the fund at a discount, particularly given it has an attractive +13.1% (net) p.a. NAV investment total return since inception in 2015, versus its benchmark of +9.1% p.a.;
- Signalling to investors the value we see on offer through us (Andrew and Steven) personally buying units in the Fund recently; and
- Using the buyback mechanism to buy OPH units in the Fund when we see compelling value on offer.
We have used all three of these since the Fund was listed.
Do interest rates affect discount/premiums for the broader pool of LIC/LITs?
It’s important, however, to understand whether other factors that are out of our control, such as interest rates, influence the cyclical nature of the premium and discount for OPH.
OPH has only been listed for a little over five years, so we need to look to longer-running LIC/LITs to see if our ‘rates relationship’ hypothesis holds, and not just for AFIC.
The evidence strongly suggests it does hold.
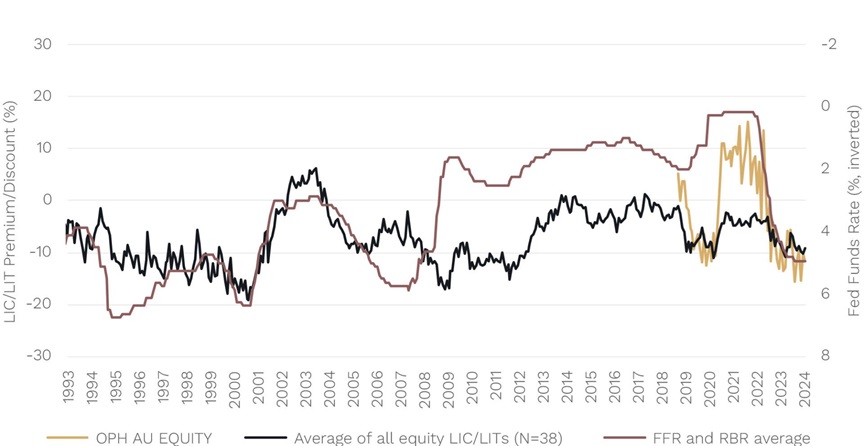
Below, we show the relationship between interest rates and the 38 long-only Australian and Global Equity LIC and LITs on the ASX. Though not a perfect relationship, the black line – the average premium or discount on these funds – has broadly moved inversely with interest rates in both the US and Australia[1].
Chart 2: LIC/LIT premiums/discounts move with rate hikes/cuts

Source: Bloomberg
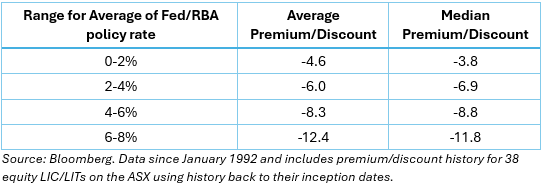
Another way to view this is through the average and median premiums or discounts that have prevailed in the equity LIC/LIT market on the ASX for different Fed/RBA interest rate ranges. We show this below for all 38 equity LIC/LITs from the chart above:

While premiums are rarer on average for the full contingent of equity LIC and LITs, it is clear, larger discounts do tend to be associated with higher interest rates.
From TINA to TIARA
This is certainly the case today, with the Fed Funds Rate the highest since the year 2000 and the RBA Cash Rate the highest since 2011.
We think it’s fair to say that the highest interest rates seen in 10-20+ years in the US and Australia is weighing on LIC/LIT premiums and discounts. That’s because higher rates are likely providing an alternative investment to LIC/LITs for some investors, which is impacting demand.
Basically, we have shifted from an interest rate world of 0% during COVID in 2020 and 2021 where the ‘TINA’ (There Is No Alternative to equities) moniker was in play and many saw shares as the only investment choice to “TIARA” (There Is A Reasonable Alternative) where fixed income and even cash investments have become more attractive again.
The OPH premium and discount has not been immune, as you can see by the yellow line in the chart above.
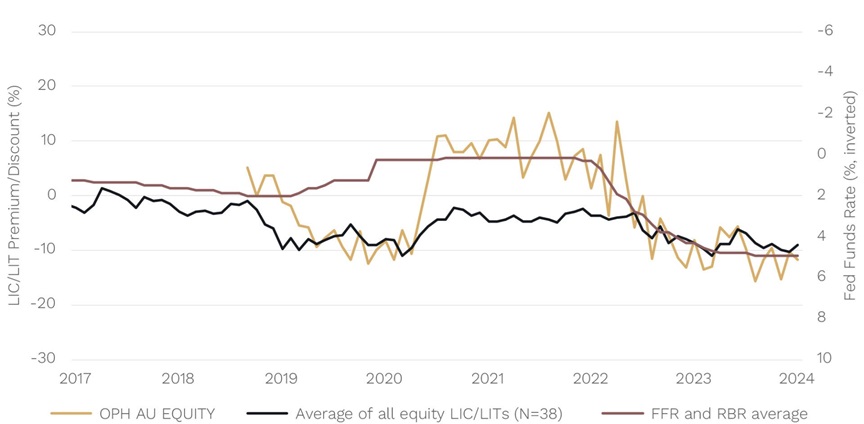
In the chart below, we have zoomed into the period since OPH listed in December 2018.
Chart 3: LIC/LIT premiums/discounts move with rate hikes/cuts

Source: Bloomberg
It traded at a premium for a few months after listing, but then fell to a discount in 2019 following recent rate hikes in the US[2].
However, when the Fed and RBA cut rates in early 2020, in response to the outbreak of COVID, OPH shot back to a premium, and the average discount for equity LIC/LITs as a whole shrunk.
Later in early-to-mid 2022 both the Fed and RBA (along with other developed economy central banks) starting hiking interest rates in response to ‘sticky’ inflation pressures.
In some of the fastest rate hiking cycles seen in decades, the OPH premium became a discount, and the average LIC/LIT market discount also began to widen again.
Springtime for LIC/LITs?
So where to from here?
We have made the case that LIC/LIT premiums and discounts in general across the market tend to be cyclical. And that cycle is heavily influenced by the direction and level of interest rates. Rates are by no means the only factor, and other factors can be more meaningful for individual LIC/LITs.
But if history is any guide, interest rate cuts are likely to be a catalyst for LIC/LIT discounts to shrink in general and premiums to widen.
Which begs the question: when is the rate-cutting cycle currently forecast by markets likely to start?
Currently, there is a greater-than-50% chance the Fed will start its cutting cycle in just over three months’ time in September. While for the RBA, rate cuts look likely to start in either very late 2024, or early 2025.
It has been a frosty winter for discounts for many LICs and LITs on the ASX in the last year or two.
But summer may be just around the corner.
[1] Policy interest rates in both the U.S. and Australia have broadly moved in line with each other since the early 1990s with coordinated hiking and cutting cycles. The exception is the U.S. Federal Reserve hiking cycle from late 2015 to late 2018 – a period over which the only change by the RBA was 0.5% of rate cuts over six months in 2016.
[2] Proposed franking credit changes by the Opposition Government in Australia in 2019 and arguably an oversupply of LIC/LITs to market also likely contributed to bigger discounts for LIC/LITs during this period.
Andrew Mitchell and Steven Ng are co-founders and Senior Portfolio Managers at Ophir Asset Management, a sponsor of Firstlinks. This article is general information and does not consider the circumstances of any investor.
Read more articles and papers from Ophir here.