A range of idiosyncratic factors continues to generate significant demand across the Industrial and Logistics (I&L) sector of commercial property. Commercial property is generally defined as real estate used for business purposes rather than residential, but is not one single investment type. Industrial units, rentals, offices and retail assets carry different dynamics at points in the property cycle.
I&L demand is currently driven by:
- An evolving ESG requirements and the growing prevalence of automated technologies which have increased the demand for prime I&L assets.
- A focus on supply chain resilience and increased cost pressures have shifted strategies in favour of holding larger inventories.
- Insufficient supply response with geographical constraints, tight planning restrictions and limited connecting infrastructure and availability of suitably-zoned land.
- Historically low vacancies and unprecedented rental growth, with an imbalance between supply and demand forecast to continue over the near term, with rents increasing at notable levels.
- The rapid growth in the population intensifying the existing shortage of stock.
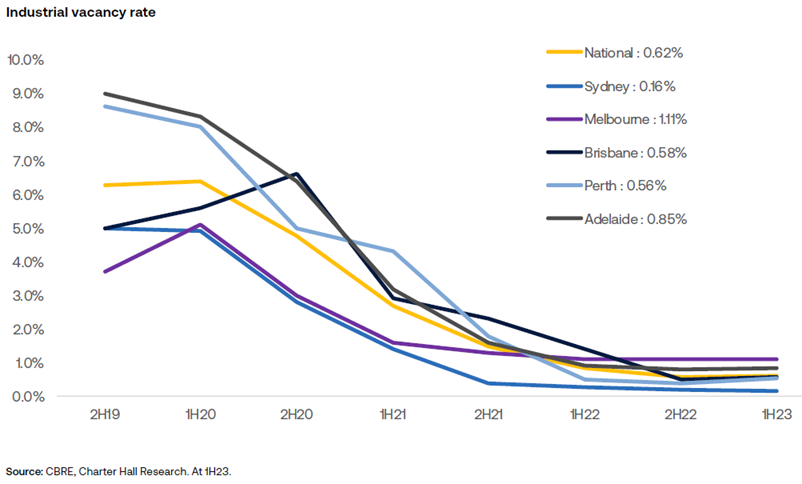
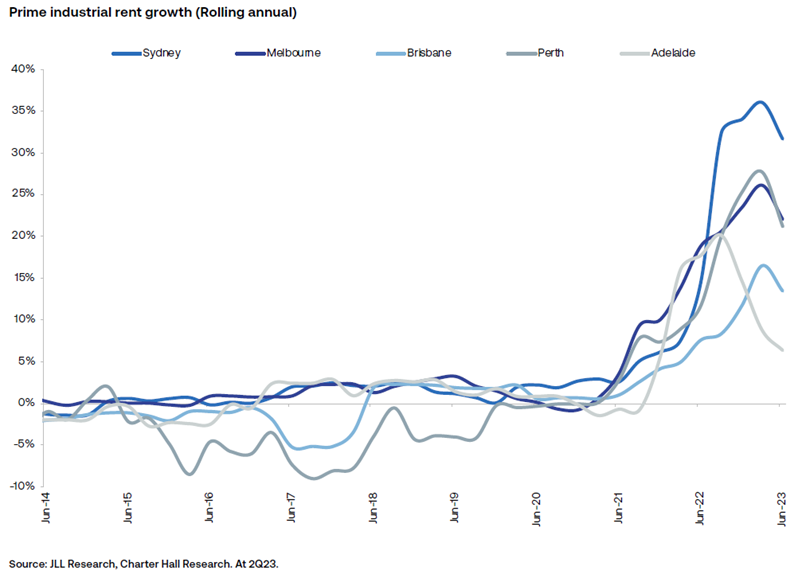
The chart below shows low vacancy rates, more future demand than coming supply and rising rents across the major Australian capital cities.
Demographics and industrial property
The relationship between population and industrial demand is intertwined: additional people introduce increased consumption requirements.
Overall demand can also be influenced by second-order demand factors such as consumption per person, supply chain efficiencies and inventory holding levels.
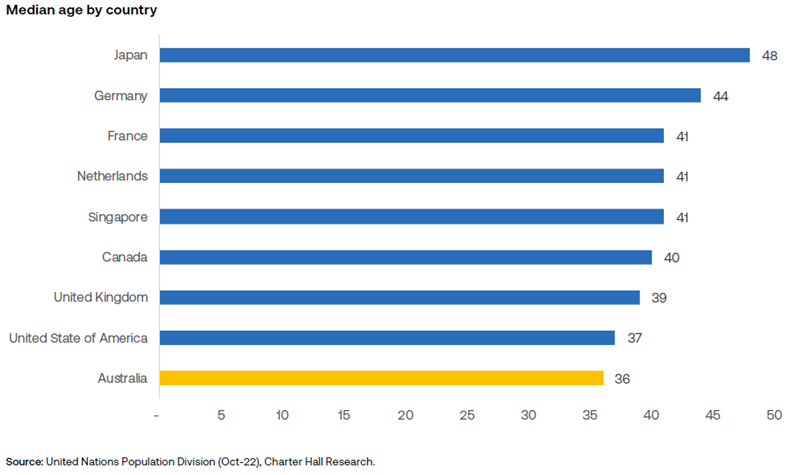
Australia’s population growth will be favourable to consumption from a demographic perspective. Australia has had a long track-record of sourcing a younger and more productive population from across the globe. It also benefits from having the wealthiest population on a per capita basis. Additionally, given the nature of relocating, new migrants have higher and immediate propensities of consumption.
This growth must be accommodated but the supply response faces ongoing challenges. Construction costs remain elevated, supporting infrastructure projects are delayed, and forward pipelines are largely pre-leased. As such, conditions remain constructive for above-trend I&L rental growth over the near-term.
Forecast I&L demand and supply
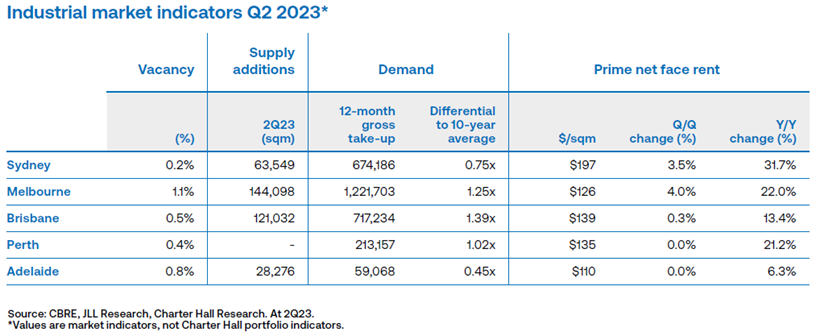
Historically low levels of vacant stock continued to restrict leasing volumes over the second quarter of 2023. Gross leasing volumes reached 786,000sqm, above the 10-year average of 688,000sqm. Activity over the quarter was led by the East Coast markets: Sydney (312,000sqm), Melbourne (275,000sqm) and Brisbane (126,000sqm).
Annual leasing volumes were broadly in line with longer-term averages, reaching 2.9 million sqm. Activity was particularly strong across the Melbourne market, which recorded gross absorption of approximately 1.2 million sqm. This was followed by Brisbane (717,000sqm), Sydney (674,000sqm), Perth (213,000sqm) and Adelaide (59,000sqm) markets.
Approximately 358,000sqm of completions were recorded over 2Q23. Completions over the quarter were concentrated across the East Coast markets: Melbourne (145,000sqm), Brisbane (121,000sqm), Sydney (64,000sqm) and Adelaide (28,300sqm).
Approximately 1.53 million sqm of developments are currently under construction and expected to complete by 2023. The forecast additions to vacancy from this remain limited, with 41% of the pipeline secured by pre-lease. This figure typically increases as lease deals are completed through the construction process.
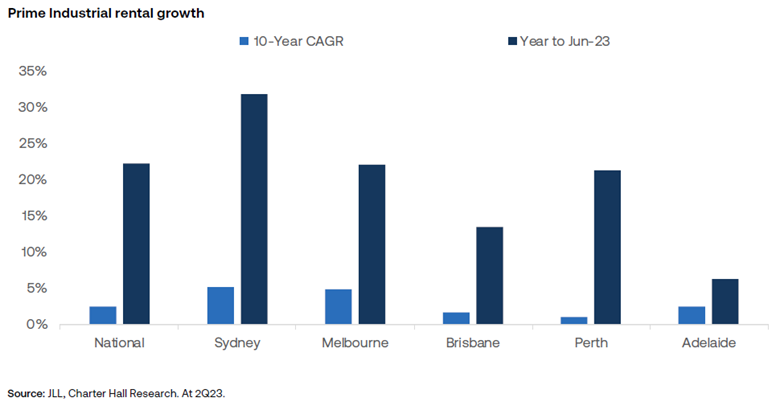
Prime rental growth
The imbalance between occupier demand and available modern, efficient warehouse space supply, continued to generate significant rental growth.
National prime rents grew by 4.4% over 2Q23 to $172/sqm. Solid q/q rental growth was recorded across Melbourne (4.0%), Sydney (3.5%), Brisbane (0.3%). Meanwhile, Perth and Adelaide were unchanged.
Solid rental growth was recorded across Sydney and Melbourne precincts over 2Q23: led by Sydney South (12.4%), Sydney Outer South West (6.0%), Melbourne West (5.3%), Melbourne North (3.9%), Sydney Outer North (3.8%), Sydney Inner West (2.9%), Sydney Outer Central West (1.9%) and Melbourne South East (1.9%).
Annual national weighted face rents increased by 22.2%, the second highest level since 1Q 1989. This was underpinned by significant rental growth across all major markets: Sydney (31.7%), Melbourne (22.0%), Perth (21.2%), Brisbane (13.4%) and Adelaide (6.3%). At a precinct level, the strong annual rent growth was led by Sydney Outer South West (35.3%), Sydney Outer North West (34.8%), Sydney Outer Central West (31.7%), Melbourne North (28.9%), Sydney South (27.2%), Melbourne West (25.0%), Perth East (23.7%) and Sydney Inner West (22.5%).
Rental growth is expected to remain above long-term averages over coming quarters, underpinned by high pre-commitment levels, a rise in construction costs delaying potential projects and above-trend occupier demand. The levels of demand continue to outweigh the new supply of stock.
The growing demand for e-commerce facilities
The rapid growth of e-commerce has contributed to historically high levels of demand for facilities over recent years. Australia is in the early stages of e-commerce growth. Online penetration rate is forecast to increase from ~14% to 23% by 2027, while total online retail spending is forecast to increase from $53 billion in December 2022 to $95 billion in December 2027.
It all adds up to favourable trading conditions in coming years for the I&L segment of commercial property. Commercial property should not all be considered the same.
Sasanka Liyanage is Head of Research and Steven Bennett is Chief Executive of Direct Property at Charter Hall Group, a sponsor of Firstlinks. This article is for general information purposes only and does not consider the circumstances of any person, and investors should take professional investment advice before acting.
For more articles and papers from Charter Hall, please click here.