Register For Our Mailing List

Register to receive our free weekly newsletter including editorials.

Home / 558

Population density trends and what they mean for housing

With Australia’s population moving through the fastest rate of growth since the 1950’s, our cities and towns are naturally densifying. At a national level, the population density of 3.5 people per square kilometre (sq. km) is among the lowest in the world, highlighting our highly urbanised population where half the populace lives in the three largest cities. In fact, 75% of Australia’s population resides on just 2.6% of the land mass.

The density of the population, which is simply the number of residents divided by the land area, becomes more relevant at a city level and even more interesting across smaller areas.

Melbourne and Adelaide have the highest population density

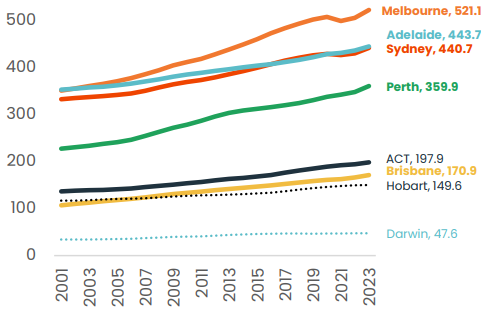
At the capital city level, the highest population density may come as a surprise – it’s not Sydney. In fact, Sydney comes in third on the population density leagues tables with 441 residents per sq. km. Melbourne (521 people per sq. km) and Adelaide (444 people per sq. km) both show an overall population density that is higher than Sydney’s.

Sydney’s lower population density relative to Melbourne and Adelaide comes despite Sydney having a larger portion of medium to high density housing stock (units comprise 39.5% of all Sydney dwellings compared with 33.4% in Melbourne), and generally smaller blocks of land (the median land area for houses sold over the past year, at 569sqm was the second lowest of any capital after Perth).

An important factor contributing to the lower population density across Sydney is the larger land area that comprises the metropolitan region. The Sydney metro area, as defined by the 2021 Greater Capital City Statistical Area (GCCSA) boundary, includes the Central Coast, the Blue Mountains, Penrith and Sutherland covering 12,369 sq. kms.

Every capital city is recording a rise in population density, however, the way this is occurring is quite different from region to region.

For example, Perth has recorded the largest increase in population over the past 20 years, with 54.4% more residents, yet it has the highest portion of detached houses of any capital, comprising 85.5% of the housing stock. Rather than ‘building higher’, Perth has densified via smaller block sizes for detached housing alongside a sprawling urban footprint, where the population has spread to the northern and southern fringes of the city.

A different example of densification can be seen in the ACT, where medium to high density housing stock has risen from a share of 25.1% of all dwellings 10 years ago to 34.2% in 2024, while the median block size for houses sold over the past 12 months remains among the highest of any capital at 750sqm.

Figure 1: Summary of population density over the past 20 years

Figure 2: Population density, Australian capitals (Number of residents per sq. km)

A closer look at the capital city trends

Analysing population density at a geographically granular level reveals inner city precincts of Melbourne and Sydney dominate the highest density locations nationally, however the rankings of density have changed remarkably over the past 20 years.

In 2003, areas of Sydney comprised 19 of the top 20 SA2’s for the highest population density. Melbourne’s CBD-East was the only non-Sydney area included in the top 20, ranked 17th.

Fast forward to 2023 and the data shows Sydney now comprises ‘only’ 13 of the top 20 highest density SA2’s, with Melbourne now occupying seven of the top 20, including the top two positions.

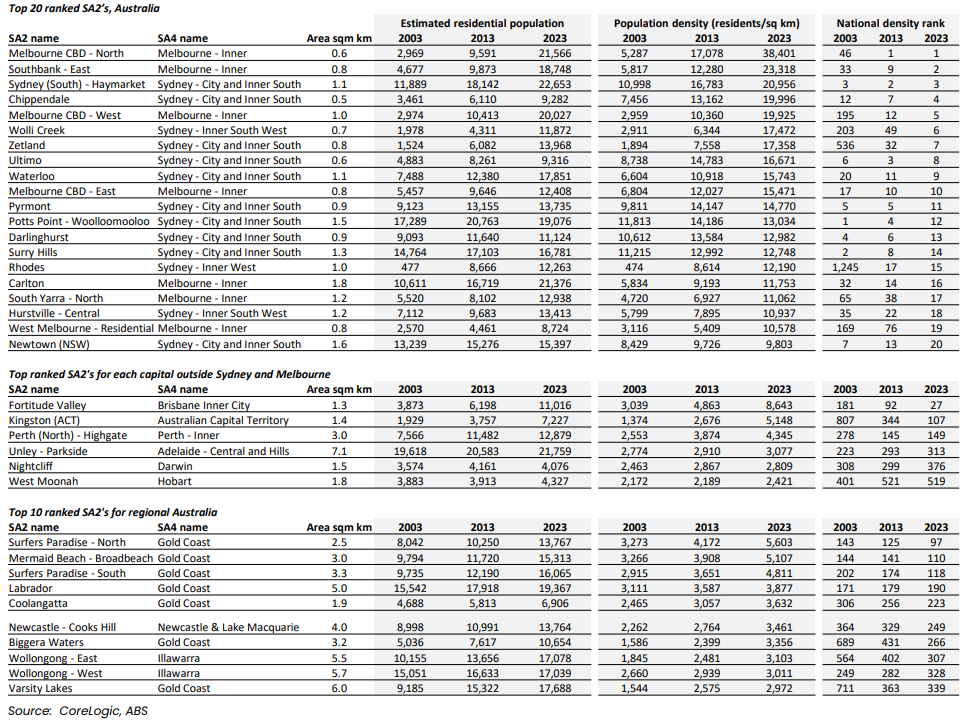
Melbourne’s CBD-North has topped the list for the highest population density in Australia since 2013. This 0.6 square kilometre area that includes the RMIT campus and Victoria Markets, was home to 21,566 residents in 2023, equating to a population density of 38,401 residents per sq. km. In 2001, this precinct was ranked 187th for population density nationally.

Melbourne’s Southbank-East SA2 region has ranked second for population density since 2019, climbing from a ranking of 113th in 2001.

The Sydney (South)-Haymarket SA2 was ranked third for population density, slipping from a consistent number one ranking between 2009 and 2012, followed by Sydney’s Chippendale and Melbourne CBD-West rounding out the top five regions for population density.

Outside of the Sydney and Melbourne metro areas, the SA2 regions with highest population density nationally were concentrated in Brisbane (Fortitude Valley was ranked 27th nationally, home to 8,643 residents per sq. km), the Gold Coast (Surfers Paradise – North was ranked 97th) and the ACT’s Kingston (107th).

Figure 3: SA2 leagues tables: highest population density in 2023

Population density and housing

The relationship between population density and rental growth is weak. Population density across the unit sector provides little explanatory value about unit rental growth over the past 12 months or the past 10 years. Areas with a high population density have shown slightly stronger rental appreciation over the past 12 months relative to lower population density areas, but slightly weaker growth over the past decade.

Figure 4: Population density trends - units

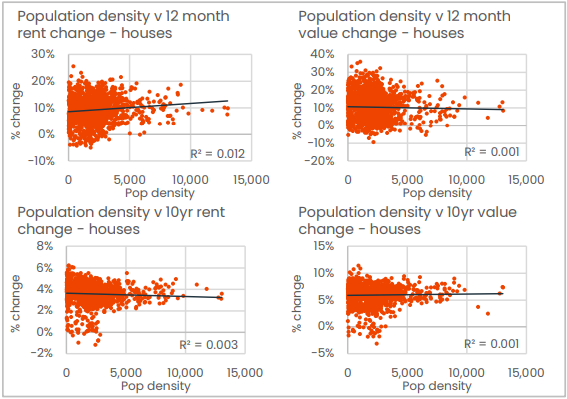
The relationship between density and appreciation in house rents is even weaker than seen across the unit sector, but the weak relationship runs opposite to that of units, where higher population densities have been associated with slightly weaker rental appreciation than areas with a lower population density over the past 12 months and slightly stronger over the past decade.

Figure 5: Population density trends - houses

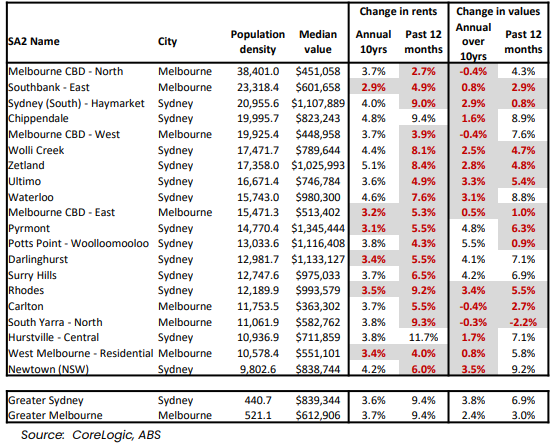
Of the 20 highest density SA2 locations nationally, only two recorded a larger rise in unit rents over the past 12 months than the capital city benchmark. Both were in Sydney: Chippendale (+9.4%) and Hurstville-Central (+11.7%).

Figure 6: Change in rents and values (unit markets within the top 20 highest population density SA2s)

The relationship between unit values and population density is more significant, with high density unit markets generally showing a lower level of value growth over both the past 12 months, and past 10 years – although the longer-term relationship is more significant, potentially reflecting periods of higher unit supply that weighed on value appreciation.

Sixteen of the top 20 have recorded a lower annual rate of unit value growth over the past decade relative to the broader capital city trend. Over the past 12 months, nine of the top 20 have underperformed.

On the other hand, high population densities provide virtually no explanatory power for house values with the coefficient of determination just .001 over the past 12 months and over the past decade.

Over the long term, precincts with a high population density tend to show slightly stronger growth in unit rents, but softer rates of capital appreciation across the unit sector, while for houses there is hardly any relationship between population density and trends in rental or value appreciation.

Stronger rental growth for units is unsurprising given the high level of amenity along with proximity to major employment nodes and academic facilities that is typical for high density precincts. They are likely to be popular across a broad range of cohorts including students, inner city professionals, service workers and migrants.

Softer value growth despite generally high levels of population growth and strong rental demand may be attributable to the propensity for higher levels of new housing supply in these same precincts. New supply, especially across the high rise sector, can be ‘bulky’ with the potential to deliver hundreds, if not thousands of new dwellings to a market in a relatively short space of time.


Tim Lawless is Executive, Research Director Asia Pacific at CoreLogic. Read or download the full report here. This article is general information and does not consider the circumstances of any investor.


14 Comments
Andrew
May 07, 2024

Tim, from an investors point of view your analysis has a major flaw: it does not take into account land area. As population density increases the average block size obviously decreases. You base your analysis on these decreasing sizes, but I'm yet to see a "shrinking" investment property.

Too many rats in the cage
May 06, 2024

Sydney is becoming more unliveable and even if the data doesn't show it, the densification is moving at a pace. The worst example is Rhodes, in 10 years it has increased 12,000 (the article shows this!). It is an absolute blot on the landscape with apartment towers all positioned along the waterway.
It is one thing for governments (the current Minns government included) to decree higher density and force on suburbs to have a supply of 6 story buildings, but there is never any talk about how the infrastructure copes with this. The developer levies seems to bolster the local council coffers but, when it comes to the need to upgrade the sewerage or water, the state needs to step in. As to then the need to decide some roads need to be designated one-way, that is a hard battle for residents, but once they succeed, its a nightmare for commuting through the suburb.
The reason is Sydney has a lot of narrow streets but, the average household seems to have at least 2 cars. So even if the apartment DA mandates car parking (1 per unit), the overflow is on the street making through travel tricky and hence the push for one way designation. An so it goes on. Sydney infrastructure is not up to coping with increased densification.
The smartest, but failed, idea was back in the 80s-90s the concept of "decentralisation". Government departments set-up up in regional towns hoping to inspire movement from the city. It didn't work - the reasons need to be examined. COVID and tech enabled WFH has increased regional attractiveness but even that is now reverting as people migrate back to the city. And lastly, the current hysteria in Sydney is about affordable housing for "essential service workers" so they can live where they work. Why are all the hospitals, for example, in the city? I think the problem is looked at from a previous era established base case and solutions are developed to fix the current. Some imagination is required.
Remember the science around rats in a cage - when there are too many, they turn on each other. Examples of this can be seen in Sydney, its lack of liveability is as much about the lack of community engagement and respect as it is about all the issues with having too many people squeezed in.

CC
May 05, 2024

total failure of government policy.
one of the highest ( if not the highest ) immigration levels in the OECD, but don't bother providing sufficient housing.
tell the younger generation to forget the Australian dream and accept shoebox apartment living, it seems.
but at least those politicians' investment property portfolios are doing well....
a national disgrace.

Dudley
May 05, 2024

Population growth at the smallest rate from 1950 to 2024:
https://www.macrotrends.net/global-metrics/countries/AUS/australia/population

CC
May 05, 2024

Well silly me, I didn't realise we have an oversupply of housing.....

Dudley
May 06, 2024

"oversupply of housing":

An undersupply of co-occupants?
https://aifs.gov.au/sites/default/files/2023-06/Figure-10_0.png

Christian
May 06, 2024

Agreed. We have John Howard and Peter Costello to thank for reducing the CGT from 100% to 50%. Investor ownership went up from 17% to 40% and prices increased from approx 3 times the average earnings to over 7. To cover the mortgage of an average house in Sydney you need to earn over $390k. This was discussed by Saul Eastlake on 7am.

Peter Taylor
May 04, 2024

The spoils from land development which can be turbo charged with high rates of imigration out weigh any real concern about the enviroment or climate change. More for less in the form of smaller more expensive block sizes, housing affordabilty, water restrictions, congested roads, fish and fishing restrictions either by price or regulation along with emerging competition camping and still no talk about what might be a sustainable population to maintain quality of life for more people.

Mal
May 04, 2024

I hope the Greater Sydney area calculation is capable of excluding, large areas of water, several large national parks, and topology where building density is not possible.

It's interesting that both Melbourne and Adelaide do not have these geographic limitations to building density.

Paul Muscroft
May 03, 2024

I think it is interesting that the generic term of "Population Growth" is used. When I look at the ABS I see that the total fertility rate (number of births per woman) is 1.7 (2021) which is way below the replacement level of roughly 2.1. Astonishingly the fertility rate dropped below 2.1 in the mid 70's. So how on earth is our population growing at all and so fast? Oh!!

Pacsun
May 03, 2024

600,000 legal immigrants in a year

Andrew Smith
May 03, 2024

Well spotted, one of many issues with our now politicised population data used for nativist dog whistling (goes back to old US fossil fuel ZPG) including estimated resident population, permanent population cohort & growth via oldies/boomers staying in data longer, while modest permanent migration (capped 190k p.a.), then significant numbers of temporary residents.

The most significant and contentious number is temporary NOM net OS migration capturing border movements of especially international students and other temporary resident 'churn' or 'froth' on top; too often described as 'immigrants' suggesting permanence but not, majority depart, hence, net financial contributors.

Not explained in the media that the NOM was expanded in 2006, according to Social Science/Stats 101 and ABS advice, pre and post 2006 cannot be compared*; ditto internationally.

Most nations do not and/or cannot use the (ABS/UNPD defined) NOM; qualitatively comparing apples with oranges, the past of permanent settler migration buyig houses versus increased mobility of 'net financial contributors' homestays, hosts, shares, apt rental etc, and support budgets as 5+ million oldies/boomers transition.

What one has never been aware of is any audit and presentation of accommodation supply types, numbers and postcodes to compare with international student demand, to assess claims they put pressure on (stagnant value) house prices.

*ABS '23 Estimates of NOM based on the previous methods and those based on the ‘12/16 month rule’ methodology (introduced 2006) are not comparable. The key change is the introduction of the ‘12/16 month rule’ for measuring a person’s residency in Australia, replacing the previous ‘12/12 month rule’.'


Kitty
May 03, 2024

Surprised by Adelaide and Melbourne topping density because they seem so sprawled. Sydney has natural boundaries that limit growth, and therefore should increase density over time, I assume?

AW
May 02, 2024

I look forward to an awakening to the effects on society at large of the environmental destruction caused by overpopulation which is the root cause of our housing crisis, in my opinion. As yet, few good folk see any connection between a healthy natural environment & a healthy economy & society.


Leave a Comment:

RELATED ARTICLES

Australian housing values reach a new record high

Baby Boomer housing needs

How AI will transform the real estate sector

banner

Most viewed in recent weeks

Are term deposits attractive right now?

If you’re like me, you may have put money into term deposits over the past year and it’s time to decide whether to roll them over or look elsewhere. Here are the pros and cons of cash versus other assets right now.

Uncomfortable truths: The real cost of living in retirement

How useful are the retirement savings and spending targets put out by various groups such as ASFA? Not very, and it's reducing the ability of ordinary retirees to fully understand their retirement income options.

Is Australia ready for its population growth over the next decade?

Australia will have 3.7 million more people in a decade's time, though the growth won't be evenly distributed. Over 85s will see the fastest growth, while the number of younger people will barely rise. 

How retiree spending plummets as we age

There's been little debate on how spending changes as people progress through retirement. Yet, it's a critical issue as it can have a significant impact on the level of savings required at the point of retirement.

20 US stocks to buy and hold forever

Recently, I compiled a list of ASX stocks that you could buy and hold forever. Here’s a follow-up list of US stocks that you could own indefinitely, including well-known names like Microsoft, as well as lesser-known gems.

Where Baby Boomer wealth will end up

By 2028, all Baby Boomers will be eligible for retirement and the Baby Boomer bubble will have all but deflated. Where will this generation's money end up, and what are the implications for the wealth management industry?

Latest Updates

Property

Financial pathways to buying a home require planning

In the six months of my battle with brain cancer, one part of financial markets has fascinated me, and it’s probably not what you think. What's led the pages of my reading is real estate, especially residential.

Meg on SMSFs: $3 million super tax coming whether we’re ready or not

A Senate Committee reported back last week with a majority recommendation to pass the $3 million super tax unaltered. It seems that the tax is coming, and this is what those affected should be doing now to prepare for it.

Economy

Household spending falls as higher costs bite

Shoppers are cutting back spending at supermarkets, gyms, and bakeries to cope with soaring insurance and education costs as household spending continues to slump. Renters especially are feeling the pinch.

Shares

Who gets the gold stars this bank reporting season?

The recent bank reporting season saw all the major banks report solid results, large share buybacks, and very low bad debts. Here's a look at the main themes from the results, and the winners and losers.

Shares

Small caps v large caps: Don’t be penny wise but pound foolish

What is the catalyst for smalls caps to start outperforming their larger counterparts? Cheap relative valuation is bullish though it isn't a catalyst, so what else could drive a long-awaited turnaround?

Financial planning

Estate planning made simple, Part II

'Putting your affairs in order' is a term that is commonly used when people are approaching the end of their life. It is not as easy as it sounds, though it should not overwhelming, or consume all of your spare time.

Financial planning

Where Baby Boomer wealth will end up

By 2028, all Baby Boomers will be eligible for retirement and the Baby Boomer bubble will have all but deflated. Where will this generation's money end up, and what are the implications for the wealth management industry?

Sponsors

Alliances

© 2024 Morningstar, Inc. All rights reserved.

Disclaimer
The data, research and opinions provided here are for information purposes; are not an offer to buy or sell a security; and are not warranted to be correct, complete or accurate. Morningstar, its affiliates, and third-party content providers are not responsible for any investment decisions, damages or losses resulting from, or related to, the data and analyses or their use. To the extent any content is general advice, it has been prepared for clients of Morningstar Australasia Pty Ltd (ABN: 95 090 665 544, AFSL: 240892), without reference to your financial objectives, situation or needs. For more information refer to our Financial Services Guide. You should consider the advice in light of these matters and if applicable, the relevant Product Disclosure Statement before making any decision to invest. Past performance does not necessarily indicate a financial product’s future performance. To obtain advice tailored to your situation, contact a professional financial adviser. Articles are current as at date of publication.
This website contains information and opinions provided by third parties. Inclusion of this information does not necessarily represent Morningstar’s positions, strategies or opinions and should not be considered an endorsement by Morningstar.