The Weekend Edition includes a market update plus Morningstar adds links to two additional articles.
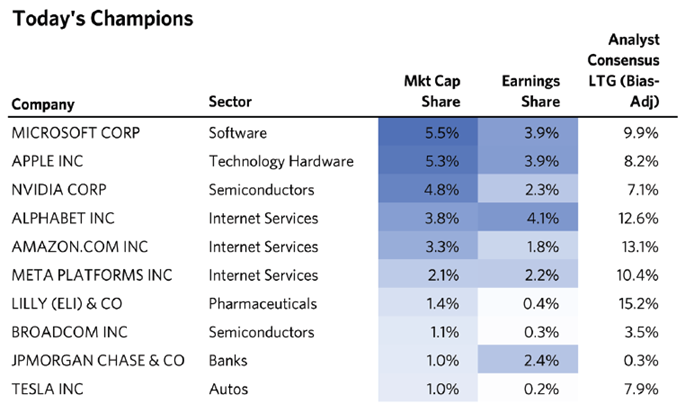
Much has been made of the concentration of the US stock market. Rightly so, given the 10 largest US companies account for almost one-third of the US equities market capitalization – the highest percentage in decades.
In a recent report, hedge fund Bridgewater Associates investigated the largest US stocks through history, how long they stayed at the top, and what led to their downfalls. They were interested in what lessons could be taken from the past and applied today.
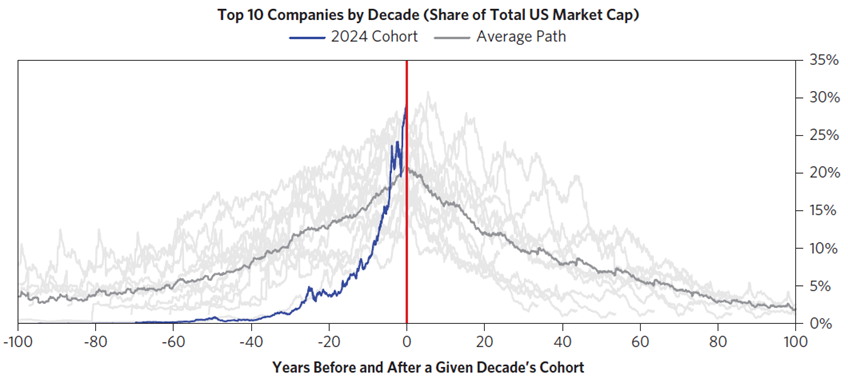
The chart below shows the rise and fall of large companies by market cap across different decades.
Source: Bridgewater Associates
The chart confirms that the concentration of the top 10 US companies is high versus the past. And that the drop-off of stocks after peaking is normally steep through history.
Staying on top is difficult
Not every era is the same. Some stock titans stay on top for decades, while others decline sharply. As a rule, though, most succumb to increasing competition and the forces of creative destruction.
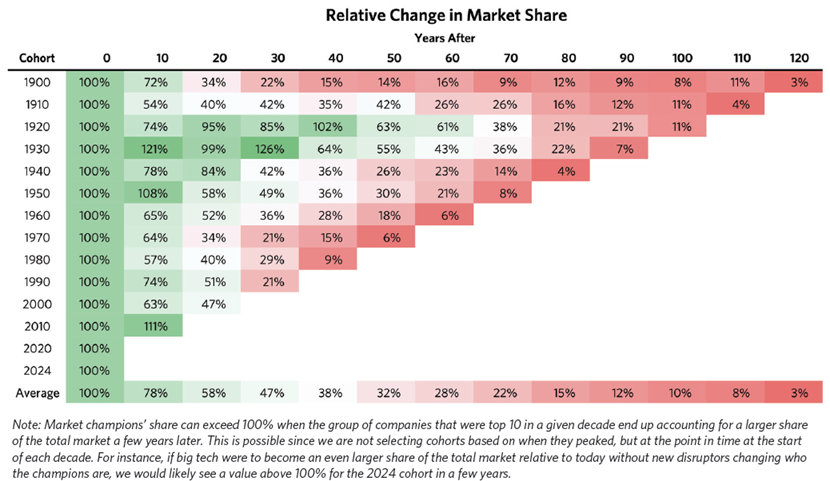
As to how leading US stocks, or ‘market champions’ as Bridgewater calls them, have performed compared to the market, the news isn’t reassuring either:
“Over a subsequent decade or two, about half of the market champions underperform the market and fall out of the top 15 champions group. And over long periods of time, almost all champions are dethroned.”
Source: Bridgewater Associates
Bridgewater suggests there’s a lifecycle to companies. The ones that turn into megacaps tend to have “first-move advantage in a high secular growth industry benefiting from rapid innovation.” These companies have an edge or moat that allows them to keep competitors at bay for a time. However, the same forces that propel their rise also lead to their downfall. Eventually, newer, faster companies take their place and gain market share.
The businesses which can stay on top normally continue to innovate and they may also receive favourable regulation along the way, keeping competitors at bay.
Stock market titans through the decades
From 1900 to 1920, railway stocks dominated the US market. Railways were central to US industrialisation, starting in the second half of the 19th century. They were the only reliable means of transporting goods across the country.
Companies competed fiercely as the railway system expanded. But by 1900, the industry had consolidated, with the formation of powerful railway monopolies. Railway companies accounted for five of the top 10 stocks by total US market cap in 1900, and that increased to six out of 10 by 1910. At their peak, railroads were more than 30% of the US market cap.

Source: Bridgewater Associates
But in the 1920s, new competition came principally from trucks (airplanes less so at that stage). Trucks were helped by less regulation on pricing and route-setting compared to rail.
From 1920 to 1940, different market leaders emerged. Oil giants moved to the top, while new companies rose, such as AT&T, the leader in building out US telephone networks. Chemicals company, DuPont, became a megacap, riding advances in materials such as the invention of nylon and Teflon. And GE emerged as a giant, first as a television broadcaster, then as an aircraft supplier.

Source: Bridgewater Associates
Many of these companies stayed on top for decades. Post World War Two and the rise of consumerism, retailers like Sears also entered the top 10 market stocks.

Source: Bridgewater Associates
In the 60s, chemicals companies lost their stock market dominance as the economy shifted away from manufactured goods to services, and research linked them to health issues, damaging their reputations. Auto companies like Ford and GM remained dominant in the 60s, though that started to fade in the 70s due to greater competition and slowing demand. Tech businesses such as IBM, Xerox, and Eastman Kodak started their ascent in the 1960s.

Source: Bridgewater Associates
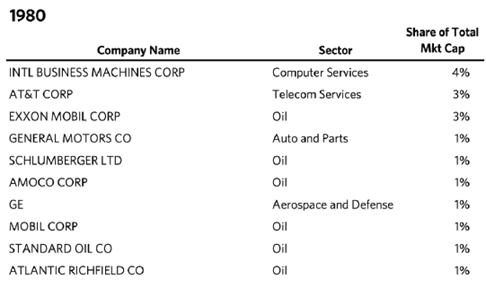
By 1980, oil stocks were back on top, thanks to an inflationary decade that saw oil prices soar. Six of the top 10 stocks were in the oil industry by then. High inflation impacted consumer demand for many companies, from retailers like Sears to the automakers.
Source: Bridgewater Associates
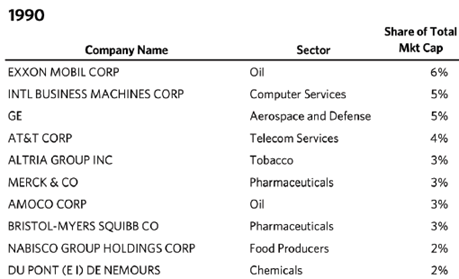
The 1990s witnessed a very different decade as inflation growth subsided. Oil companies lost their dominance. Pharmaceutical companies including Merck and Bristol-Myers entered the top 10 stocks, with the discovery of blockbuster drugs like Merck’s hepatitis B vaccine.
Source: Bridgewater Associates
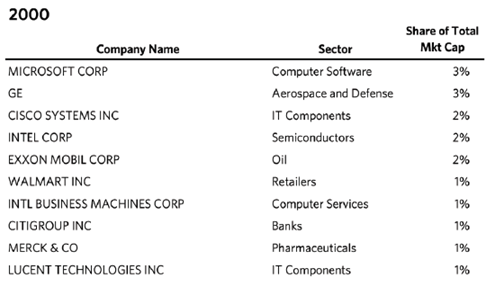
By 2000, tech was ascendant, with five businesses (Microsoft, Cisco, Intel, IBM, and Lucent) in the leading 10 stocks by market cap. Walmart made its first appearance as a megacap. Meantime, Citigroup, following the merger of Citicorp and Travelers Group, became the first bank to make the list since 1930.
Source: Bridgewater Associates
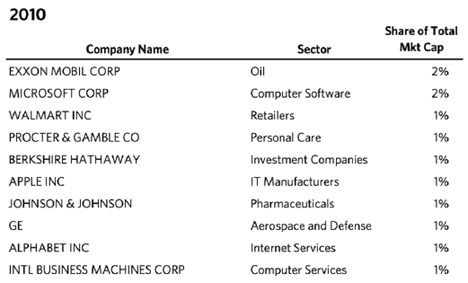
By 2010, the tech bubble had burst, and the world was still recovering from the worst financial crisis since the Depression. More defensive companies (Berkshire, Walmart, Procter & Gamble, and Johnson & Johnson) made it into the top 10 stocks. GE started to slip as acquisitions from a prior CEO Jack Welch turned awry. Telecom companies like AT&T declined due to the fading relevance of landlines over cellular networks, anti-trust regulation removing longstanding barriers to entry, and the rise of new cellular and internet-focused players.
Source: Bridgewater Associates
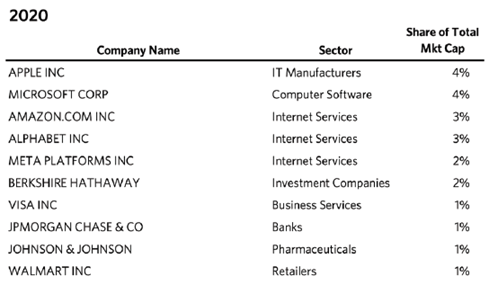
The 2020s have been dominated by the IT companies, with incredible growth from social media, smartphones, and software. The leading five stocks were all tech firms.
Source: Bridgewater Associates
Source: Bridgewater Associates
Global portfolios hold more US megacaps than ever
The current concentration of the US market has implications for Australian investors too. The leading 10 stocks in the US not only make up almost one-third of the US total market cap but they also account for close to 20% of the global total market cap – the highest in more than 50 years. In other words, anyone investing overseas is likely to have high exposure to these stocks.
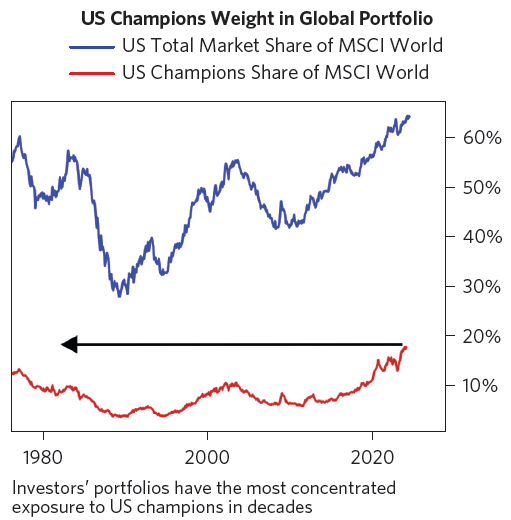
Source: Bridgewater Associates
----
In my article this week, I look back on my investing over the past 25 years, especially early on, and one recurring theme stands out: a desire to be proven right. As a buyer of an asset, I’d like to think that I have some kind of edge versus other investors, especially those who are selling to me. However, taken too far, the desire to be proven right can be costly. Everyone has cognitive biases like this, and the key is to have an investment plan that protects us from acting on our worst instincts.
James Gruber
Also in this week's edition...
One of Warren Buffett's most successful investments is also one of his oldest. Buffett bought confectionery company, See's Candies, more than 50 years ago. the business is still going strong and John Rekenthaler believes Buffett's investment illustrates that great stocks need not be growth companies.
As superannuation balances continue to swell, a common question that super funds are getting is: what happens to my super when I die? It’s an important issue and why understanding how to plan your super death benefits and what steps to take may make things clearer and easier for family members and other beneficiaries. UniSuper's Brooke Logan offers a great overview on estate planning and super.
One small bet on a speculative stock isn’t so bad, right? Think again, says Geoff Saab. He says historical evidence tells us that these high-risk gambles, on average, don’t pay off. And, importantly, we don't stop at just one speculative stock - we'll more often than not buy more.
Bonds have had a terrible time of it in recent years, though 2024 has seen a minor uptick. Perhaps investors are sniffing out better times ahead as interest rates near their peak. Vanguard's Jean Bauler says this investor positioning makes sense because bonds typically perform strongly in the years following a peak in rates.
What was the best performing asset this year in US dollar terms to the end of July? If you guessed US stocks, you'd be incorrect. The right answer is gold. The yellow metal is up more than 30% year-to-date and seems to now be getting on retail investor radars. Ray Gia looks at why gold warrants an allocation in investor portfolios.
Seemingly the whole of Australia revelled in the feats of our athletes at the Olympic Games, especially the gold medallists. But did any of you caste an eye over the silver or bronze medallists? I did, and I noticed that bronze medallists seemed a lot happier than the silver medallists with their accomplishments. Tony Dillon suggests that I wasn't just imagining this, as scientific evidence backs up my observation. And Tony says the phenomenon has implications for investors too.
Two extra articles from Morningstar this weekend. Joseph Taylor highlights two high quality ASX bargains and a banking growth story where investors may be too optimistic.
Lastly, in this week's whitepaper, Clime's John Abernethy provides a detailed market outlook in his annual letter to investors.
***
Weekend market update
On Friday in the US, shares rallied strongly after Federal Reserve chairman Jerome Powell suggested that policymakers were poised to starting cutting interest rates next month. The S&P 500 and Nasdaq were up 1.2% and 1.5% respectively. The yield on the US 10-year note fell 5 basis points to 3.80%. Gold ended 1.1% higher at US$2,513, while Bitcoin ripped 6.5% to US$64,484.
From AAP Netdesk:
The local share market on Friday was unable to extend its longest winning streak in nearly a decade, with the benchmark index finishing ever-so-slightly lower but still above the key psychological level of 8,000. The S&P/ASX200 finished Friday at 8,023.9, down 3.1 points from Thursday, but up 0.7% for the week.
Five of the ASX's 11 sectors finished lower on Friday and five closed higher. Utilities was the biggest mover, dropping 1.3% as Origin Energy fell 2%.
Inghams was the biggest loser in the ASX200, falling 20.2% to a one-year low of $3.09 after the poultry producer disclosed its new supply contract with Woolworths, its biggest customer, would cut volumes.
Spark fell 7.4% to a four-year low of $3.63 after the Kiwi telecommunications company announced its full-year profit was down 72% to NZ$316 million (A$289 million).
Telix dropped 3% to $19.18 after the Melbourne-based radiopharmaceutical company announced it had swung to a first-half net profit of $29.7 million, compared to a $14.3 million loss a year ago.
Accent Group dropped 15.3% to a two-week low of $2.05 after the Athlete's Foot, Platypus Shoes and Hype DC shoe store owner announced its full-year profit had dropped by nearly a third, to $59.5 million.
On the flip side Fisher & Paykel Healthcare soared 11.9% to a three-year high of $32.83 after the Kiwi respiratory product company upgraded guidance.
In the financial sector, ANZ dropped 2.2% to $29.30 after financial regulator APRA required it to hold an additional $250 million in risk capital following issues in its markets business.
Insurance companies IAG, Suncorp and QBE all gained around a percentage point.
In the heavyweight mining sector, Fortescue fell 2% to $17.97, BHP dipped 0.8% to $40.67 and Rio Tinto retreated 1.3% to $110.73.
Curated by James Gruber and Leisa Bell
Latest updates
PDF version of Firstlinks Newsletter
Australian ETF Review from Bell Potter
ASX Listed Bond and Hybrid rate sheet from NAB/nabtrade
Monthly Bond and Hybrid updates from ASX
Listed Investment Company (LIC) Indicative NTA Report from Bell Potter
Plus updates and announcements on the Sponsor Noticeboard on our website