Register For Our Mailing List

Register to receive our free weekly newsletter including editorials.

Home / 575

Why I'm a perma-bull on stocks

Like many older people, my mother’s attitude to money and investing is simple. Save up cash, buy a house, upgrade to a better house in her case, put spare money into the bank, and use that savings plus the age pension to see out your remaining days.

My mother has always been suspicious of the share market. For her, it’s a quasi-form of gambling. Far too volatile for her to part with her bank savings.

The risks in not taking risk

While I’ve inherited some of her conservative ways, I’ve learned through my investing career that people like my mother overestimate the risk of owning stocks and underestimate the risk of not owning them in the long-term.

This chart illustrates it well.

Vanguard chart

Click for larger image

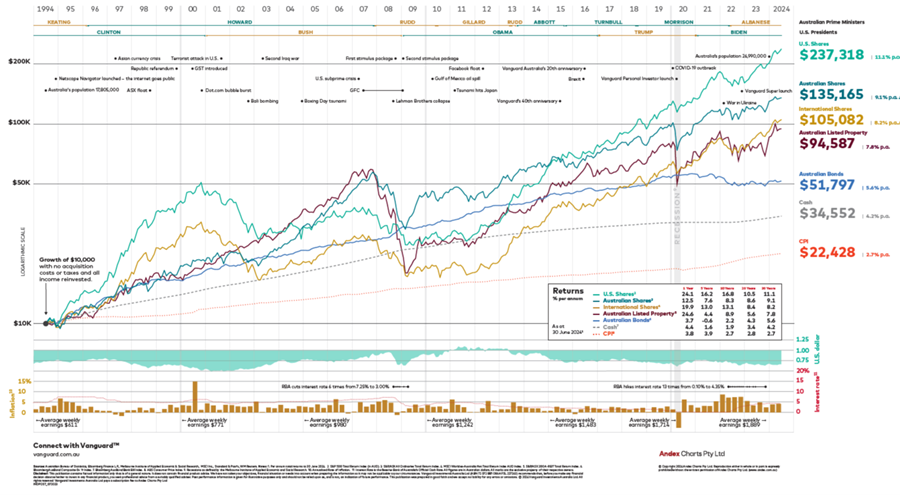
The chart shows the how a starting balance of $10,000 would have changed in value after being invested into six asset classes over the past 30 years. The top performer has been US stocks, where $10,000 investment in the leading 500 US companies in 1994 would have grown to $237,318 now. At an average total annual return of 11.1%, an investor would have made about 23x their money, assuming no additional investments and the reinvestment of all income distributions.

Australian shares have been the second-best performer, with a 9.1% per annum average annual return for the All Ordinaries Index over the 30-year period. Notice how much a 2% difference in annual returns between Australian and US stocks makes to total cumulative returns. An Australian share investor made more than $100,000 less!

International shares returned a little less, with an 8.2% annual return.

Fourth place goes to Australian listed property, measured by the S&P/ASX 200 A-REIT Total Return Index, where a $10,000 initial investment would have grown to $94,587, an average annual return of 7.8%.

Australian bonds are next, returning 5.6% per annum, and cash trails the pack with an average annual return of 4.2%.

Notice how much a small difference in average annual returns makes to the total cumulative returns of the different asset classes. For instance, 2% difference in annual returns between Australian and US stocks results in a $100,000 difference in total return. A 3.5% difference in annual returns means Australian stocks made $83,000 more than Australian bonds over the 30 year period.

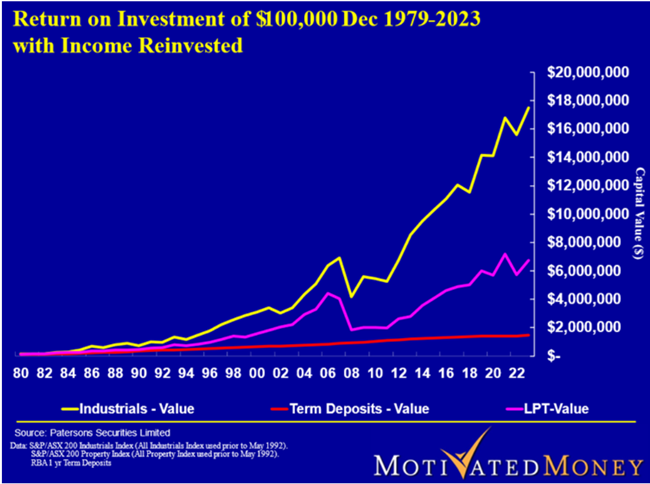
Peter Thornhill’s tweak

Well-known financial author and friend of Firstlinks, Peter Thornhill, makes a similar case for the power of owning shares in the long run, but with a twist. He advocates holding a particular part of the Australian share market, namely industrials.

In his eyes, buying and holding industrial shares is superior to owning the All Ordinaries. It’s also better than holding resources and property stocks, which have underperformed in the long term, primarily due to their capital intensive operations.

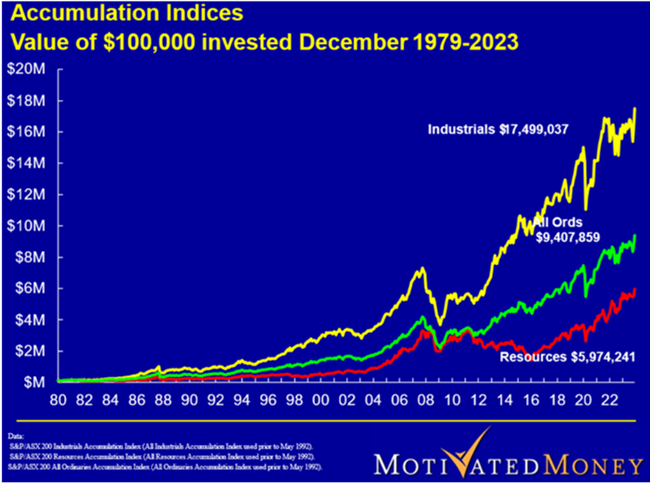
Thornhill says the opportunity cost of not owning stocks is too large to ignore.

Another perspective on returns

People like my mother will look at the above and think that’s all well and good, but what about the potential to lose a lot of money on stocks in the short term, or even medium-term.

Here’s a breakdown of ASX All Ordinaries Index returns over the past 124 years.
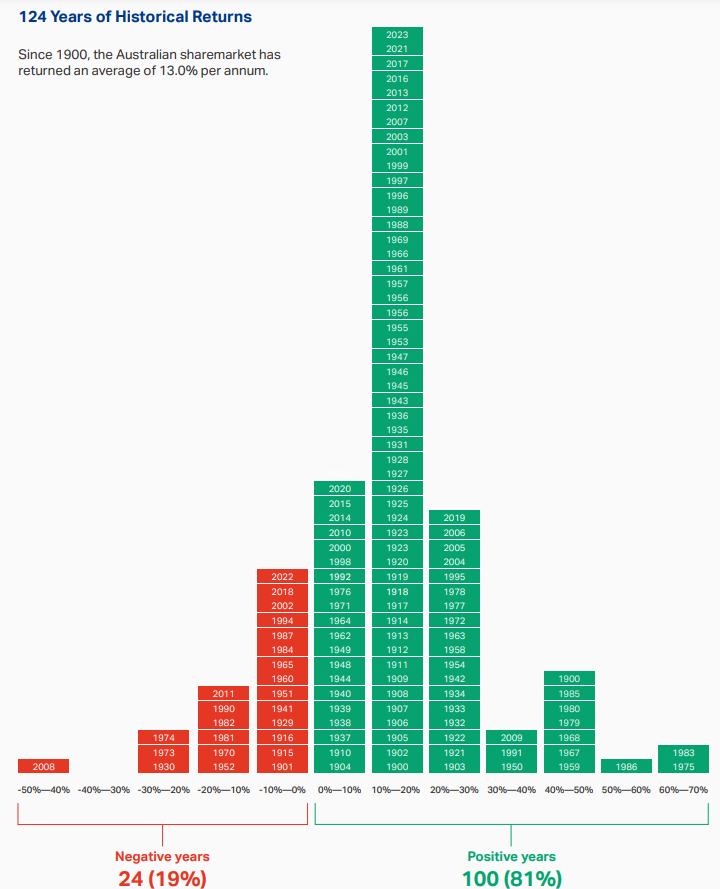

Source: ASX

The ASX All Ords has returned 13% per annum since 1900. 100 of the 124 years have resulted in positive returns – that’s 81%, or four out of every five years.

Also, if you hold shares for a period of seven years or longer, the chances of getting positive returns in Australia and internationally is almost 100%.
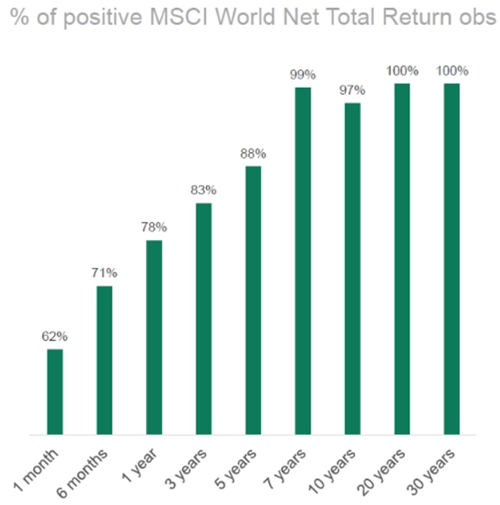

Source: Firetrail

Stock returns aren’t magic

The returns from stocks don’t come out of nowhere; they’re driven by earnings. Though these earnings can go up and down, they’ve consistently gone up in the long term.

Legendary stock picker, Peter Lynch, highlighted this in a speech in 1994:

“Some event will come out of left field, and the market will go down, or the market will go up. Volatility will occur. Markets will continue to have these ups and downs. … Basic corporate profits have grown about 8% a year historically. So, corporate profits double about every nine years. The stock market ought to double about every nine years. So I think — the market is about 3,800 today, or 3,700 — I'm pretty convinced the next 3,800 points will be up; it won't be down. The next 500 points, the next 600 points — I don’t know which way they’ll go. So, the market ought to double in the next eight or nine years. They’ll double again in eight or nine years after that. Because profits go up 8% a year, and stocks will follow. That's all there is to it.”

Essentially, Lynch is saying; buy stocks, hold them, and ignore everything else.

Funnily enough, the Dow Jones Industrial Average has compounded at 8% per annum in the 28 years since Lynch made that speech, while earnings compounded at a marginally lower rate.

Buying shares is easy, holding onto them is harder

Through the years, I’ve learned that investing is probably 20% maths and 80% psychology. It’s one thing to understand the power of owning stocks and compounding, it’s quite another to be able to stick with shares during tough times.

Respected investment author, William Bernstein, suggests many investors can’t handle volatility and their portfolios need to reflect that.

“… yes, compounding is magic, but you have to observe Charlie Munger’s prime directive of compounding, which is never to interrupt it. So, you have to design your portfolio not with the normal 98% of the world and 90% of the time in mind. You have to design your portfolio with the worst 2% of the time in mind so that you don’t interrupt compounding, which basically translated into plain English means that you probably should have more safe assets than you think you should have. In other words, a suboptimal portfolio that you can execute is better than a stock-heavy optimal one that you cannot execute.”

Bernstein has a point though I have a different take. Yes, switching portfolios at the wrong time can lead to terrible results. However, implementing a suboptimal portfolio also comes with a huge opportunity cost. It can mean leaving tens of thousands, or maybe a lot more, on the table. It can mean the difference between an ok outcome and building real wealth.

Which stocks?

You might be like my mother reading this (at least I hope she is) and thinking, “Alright, I’ll buy some stocks, or buy more stocks as the case may be, but which stocks should I buy?”

I’ve looked at how to build a lazy portfolio in a previous article.

The easy and low cost way to buy stocks is via ETFs which cover the entire market. For example, Vanguard’s Australian Shares Index ETF (ASX: VAS) tracks the ASX 300, which comprises most of the listed stocks. For international exposure, Vanguard’s MSCI Index International Shares ETF (ASX: VGS) covers the world ex-Australia stocks.

If you want to own stocks directly, I’ve written of 16 ASX stocks to buy and hold forever, and 20 US stocks to own indefinitely.

If you’re after income from companies, I’ve also written of 11 dividend stocks worth holding for the long term.

Finally, if Peter Thornhill’s ideas piqued your interest, there’s a well-run listed investment company (LIC) that invests solely in ASX industrial shares – Whitefield Ltd (ASX: WHF).

Final word

My argument that there's only one place invest to build wealth for the long term depends on investors having the right risk capacity and investment horizon. Please seek advice if you need it.


James Gruber is the Editor of Firstlinks.


19 Comments
simon
August 30, 2024

2024 Whitfield Annual Report
"40 year portfolio return ( before tax, costs, leverage etc) - 11.46% (pa)"
"40 year NTA plus dividends and franking return -12.94% (pa)"
Can be lowish turnover if you want to buy/sell but if you want to hold long term it's comparable to S&P 500.

Dudley
August 30, 2024

Using: https://www.marketindex.com.au/asx/whf/advanced-chart

Returns:

From 02/07/1990 (indexed to 100), change:
ADJ-usted for dividends etc:
= (2365.41/100) ^ (1 / ((DATEVALUE("01/08/2024") - DATEVALUE("02/07/1990")) / 365.25)) - 1
= 9.72% / y
Not ADJ-usted for dividends etc:
= (575.52/100) ^ (1 / ((DATEVALUE("01/08/2024") - DATEVALUE("02/07/1990")) / 365.25)) - 1
= 5.27% / y
About 50% of growth RATE is due to capital gain.

From 26/08/2019 (indexed to 100), change:
ADJ-usted for dividends etc:
= (139.29/100) ^ (1 / ((DATEVALUE("26/08/2024") - DATEVALUE("26/08/2019")) / 365.25)) - 1
= 6.85%
Not ADJ-usted for dividends etc:
= (114.67/100) ^ (1 / ((DATEVALUE("26/08/2024") - DATEVALUE("26/08/2019")) / 365.25)) - 1
= 2.77% / y
About 40% of growth RATE is due to capital gain.

Dudley
August 30, 2024

Washington H Soul Pattinson & Company Ltd (SOL)
https://www.marketindex.com.au/asx/sol/advanced-chart

Returns:

From 02/07/1990 (indexed to 100), change:
ADJ-usted for dividends etc:
= (220758.92/100) ^ (1 / ((DATEVALUE("01/08/2024") - DATEVALUE("02/07/1990")) / 365.25)) - 1
= 25.35% / y
Not ADJ-usted for dividends etc:
= (3729.68/100) ^ (1 / ((DATEVALUE("01/08/2024") - DATEVALUE("02/07/1990")) / 365.25)) - 1
= 11.20% / y
About 45% of growth RATE is due to capital gain.

From 26/08/2019 (indexed to 100), change:
ADJ-usted for dividends etc:
= (192.95/100) ^ (1 / ((DATEVALUE("01/08/2024") - DATEVALUE("26/08/2019")) / 365.25)) - 1
= 14.25%
Not ADJ-usted for dividends etc:
= (169.44/100) ^ (1 / ((DATEVALUE("01/08/2024") - DATEVALUE("26/08/2019")) / 365.25))
= 11.28% / y
About 80% of growth RATE is due to capital gain.

Ivan
August 30, 2024

OZXX is an industrial only ETF listed on the ASX. If you wanted industrials plus financials, then simply combine OZXX with QFN (a financials ETF) in whatever proportion you feel comfortable with.

James Gruber
August 30, 2024

Nice one, Ivan.

CC
August 30, 2024

a quick look at OZXX shows it's largest holding is WES at 11% followed by CSL at 9%. This makes no sense to me
considering CSL has a much larger market cap than WES ( $140B versus $80 approx )

David
August 29, 2024

Is Soul Pattinson another option alongside Whitefield? Comparing their respective share prices over the longer term produces an interesting outcome.

David2
August 30, 2024

I was thinking the same thing! Whitefield shareprice has gone sideways for 5 years at a 3.5% yield. Soul Patts on the other hand....

michael
August 30, 2024

Soul pats major investment is a coal mine, I believe.

I have yet to find an LIC with acceptable characteristics. They seem moribund, possibly hanging on to historical shares to save tax.

Sam
August 30, 2024

Souls 40% of New Hope (coal) is about $1.5b of their nearly $13b market cap. The laundry list of other investments is very long

Kevin
August 30, 2024

New hope is,I was surprised at that.Their strategic p/ folio is 48% of investments.

Large cap is 21%,and private equity is 11%.

Strategic is New Hope,Brickworks and TPG. Large cap is BHP , Macbank ,CSL and CBA.

Download last year's annual report,it is the 120 year report so gives you a bit of history. I was quite surprised that it wasn't as good as I thought. The 40 year return was $1K grew to $291K, 15.2% CAGR (1983 to 2023).

I picked Wesfarmers as the Australian BRK back in the 1990s.Their update early this year gave a CAGR of 19.5 % for 40 years ( 1984 to 2024 ) so $1K turned into $1.2 million.

I think for this century SOL had been compounding @ 12.5% and they gave a figure of just over 9% for AXJOA.. You'll need to check that but 12.5% for a few decades will do nicely Depends how much you put in in 1 hit at the start.What's it now $34K for 1,000 shares?

New Hope was by far their largest dividend payer ($202 million) with BHP next at ~ $40 million .Check the last annual report. I don't know their reporting dates,perhaps the 2024 report is due shortly

James Gruber
August 30, 2024

Hi David,

A different beast. Whitefield is an LIC while Soul Patts is a conglomerate. Like Souls and it's included in my article linked above, 16 stocks to buy and hold forever.

Cheers,
James

Mark Hayden
August 29, 2024

Thanks James - a good article on long-term investing. An additional point is that earnings come from the economy and share prices come from the investment markets. Not sure about your 80/20 hypothesis; my thoughts are that a significant minority of articles are on the long-term, but investors should spend the majority of their time on that aspect.

Dudley
August 29, 2024

"investment horizon": 'Knocking on Heaven's Door' = taking risk is pointless or mere entertainment.

Ray
August 29, 2024

Great article James,
I've read and heard Peter Thornhill speak about his conviction on industrial stocks, but have never been quite sure which stocks they are.
Is it the ASX stocks that appear in the S&P/ASX 200 Industrials Index?
ie: https://www.marketindex.com.au/asx/sectors/industrials
I assume there is no ETF that covers this index, like there is for say the ASX tech stocks with ATEC or mining stocks with MVR?

James Gruber
August 29, 2024

Hi Ray,

Thanks.

That's my understanding as per my reply to James' query in this comments thread.

As for ETFs, I'm not aware of any that provide exposure to the ASX 200 ex energy and miners.

Best,
James

James
August 29, 2024

"Finally, if Peter Thornhill’s ideas piqued your interest, there’s a well-run listed investment company (LIC) that invests solely in ASX industrial shares – Whitefield Ltd (ASX: WHF)."

Not entirely correct. More correct perhaps to say WHF doesn't invest in RESOURCE companies and so avoids their cyclicality and sometimes egregiously bad CAPEX decisions, disasters etc.

From the WHF March 2024 Annual Report by category weighting:
Banks: 28.17% (mostly CBA);
Non Bank Financials: 12.24%;
Healthcare: 12.07% (mostly CSL);
Consumer Discretionary: 10.56%;
Real Estate: 9.67% (A-REITs);
INDUSTRIALS: 9.61%;
Consumer Staples: 5.84%;
Communication Services: 4.4%
Information Technology: 3.11%;
Materials: 2.73%;
Utilities: 1.6%.

So less than 10% Industrials and a very large weighting of >40% to Banks/Non Bank Financials.

James Gruber
August 31, 2024

Hi James,

I should have been clearer. When Peter Thornhill refers to industrials, it includes banks. So in the second chart in this article, 'Industrials' is based on the ASX 200 Industrials Accumulation Index (in the footnote) and that index is the ASX 200 excluding the energy and mining sectors.

I have applied this same definition to Whitefield, hence the reference to industrials.

Hope that makes sense.

James

CC
August 30, 2024

He uses the term Industrials loosely to refer to
non Mining/Energy stocks


Leave a Comment:


RELATED ARTICLES

Church of Apple

The BIG picture: portfolios perform for the passive and patient

Active or passive – it’s time to change the narrative

banner

Most viewed in recent weeks

Warren Buffett changes his mind at age 93

This month, Buffett made waves by revealing he’d sold almost 50% of his shares in Apple in the second quarter. The sale not only shows that Buffett has changed his mind on the stock but remains at the peak of his powers.

Wealth transfer isn't just about 'saving it up and passing it on'

We’ve seen how the transfer of wealth can work well, with inherited wealth helping families grow and thrive for generations, as well as how things can go horribly wrong. Here are tips on how to get it right.

A health scare changes my investment plans

Recently, I spent time in hospital for pneumonia. Health issues can clarify what really matters, and one thing became clear to me: 99% of what we think is important is either irrelevant or doesn’t need our immediate attention.

CPI may understate the rising costs of retirement

Rising prices have a big impact on retirement outcomes yet our most common gauge of inflation – the consumer price index – misses several important household costs for retirees.

The tortoise wins in investing

For decades, it’s been a truism that taking greater risks with stocks should equate to higher returns. New research casts doubt on that and suggests investing in ‘boring’ stocks and industries may be a better bet.

Rethinking how retirees view the family home

Australia faces a wave of retirees at a stage where the superannuation system is still maturing. Better and fairer policy on the role of the family home as a retirement asset might help.

Latest Updates

Shares

Why I'm a perma-bull on stocks

Investors overestimate the risk of owning stocks and underestimate the risk of not owning them. In the long run, shares crush other major asset classes, yet it’s one thing to understand this, it’s another to being able to execute on it.

Shares

Australia: Most listed stocks per capita and biggest gamblers in the world

Australia has more listed companies per head of population than just about any other country on earth – and many times more than the US. This explores why that is and whether it's connected to our well-known love for a punt.

SMSF strategies

Meg on SMSFs: Winding up SMSFs paying a pension requires care

It’s common to assume that once a member decides to wind up their SMSF, it should happen as quickly as possible. But sometimes slowing down can be important, particularly if there are pensions involved.

Property

Will house prices crash?

Absent much higher interest rates and or unemployment, a house price crash in Australia looks unlikely. However, a failure to boost affordability risks a further slide in home ownership and rising inequality.

Investing

Is the passive investing dream waning?

There are signs that passive investing is struggling to keep up in a world that's rapidly passing it by. To understand why, we need to talk about how private equity has revolutionised the investment landscape.

Shares

What performs best after peaks in market concentration?

US market concentration in large technology companies has captured investor attention. Here explores how this concentration compares to history and what typically follows periods of extreme concentration.

Investment strategies

Why investors will continue to pay up for the US market and Mag 7

Recent volatility has reflected nervousness about tech stocks in the US and whether they can deliver returns on massive AI investment. With rates set to fall, these stocks and the broader US market should continue to find favour.

Sponsors

Alliances

© 2024 Morningstar, Inc. All rights reserved.

Disclaimer
The data, research and opinions provided here are for information purposes; are not an offer to buy or sell a security; and are not warranted to be correct, complete or accurate. Morningstar, its affiliates, and third-party content providers are not responsible for any investment decisions, damages or losses resulting from, or related to, the data and analyses or their use. To the extent any content is general advice, it has been prepared for clients of Morningstar Australasia Pty Ltd (ABN: 95 090 665 544, AFSL: 240892), without reference to your financial objectives, situation or needs. For more information refer to our Financial Services Guide. You should consider the advice in light of these matters and if applicable, the relevant Product Disclosure Statement before making any decision to invest. Past performance does not necessarily indicate a financial product’s future performance. To obtain advice tailored to your situation, contact a professional financial adviser. Articles are current as at date of publication.
This website contains information and opinions provided by third parties. Inclusion of this information does not necessarily represent Morningstar’s positions, strategies or opinions and should not be considered an endorsement by Morningstar.