Register For Our Mailing List

Register to receive our free weekly newsletter including editorials.

Home / 594

The perfect portfolio for the next decade

Let’s first review the performance of the major asset classes and sub-sectors in 2024.

Asset class returns
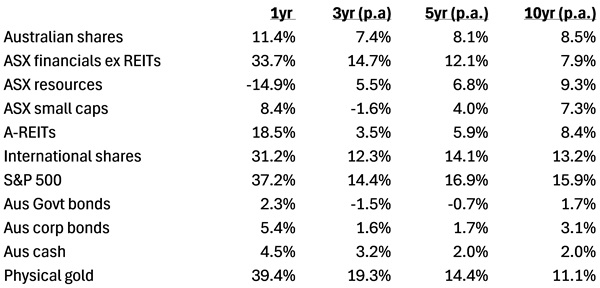
Note: All figures as at Dec 31, 2024. Aus shares = ASX 200, A-REITs = S&P/ASX 200 A-Reit Index, International shares = MSCI World ex-Aus in AUD, Aus Govt bonds = Bbg AusBond Treasury Index, Aus Corp bonds = Bbg Ausbond Credit 0+ index. Source: S&P Global, Bloomberg, Firstlinks

The winners in 2024

The asset with the highest return last year would surprise many: it was gold, which jumped 39% in Australian dollar terms. Other big winners were US shares, up 37%, and Australian financials, with a 34% return.

The gold price rose by 27% in US dollar terms, but higher in Australian dollars thanks to a fall the Aussie dollar against the greenback.

Why did gold go up so much? Historically, gold has tended to move inversely to the US currency – when the US dollar rises, gold often falls. But that wasn’t the case in 2024.

The World Gold Council's John Reade explained to Firstlinks in late October that gold has benefited from two things: central bank buying and emerging market demand. Central banks have been purchasing gold as they seek diversification following the American confiscation of Russian US dollar assets after Putin’s invasion of Ukraine. Emerging markets have also been keen on the yellow metal, as the Chinese seek safety amid their economic downturn, and other countries such as India and Turkey increase their buying of jewelry and other gold-related products.

It’s intriguing that Australian investors, especially institutions, generally shun gold, in spite of its recent strong performance.

US shares grabbed far more headlines than gold with its barnstorming 2024. The S&P 500 rose more than 20% for a second year in a row, driven by earnings and an increase in the valuations attached to those earnings. S&P 500 operating earnings rose 9% during the year to new record highs.
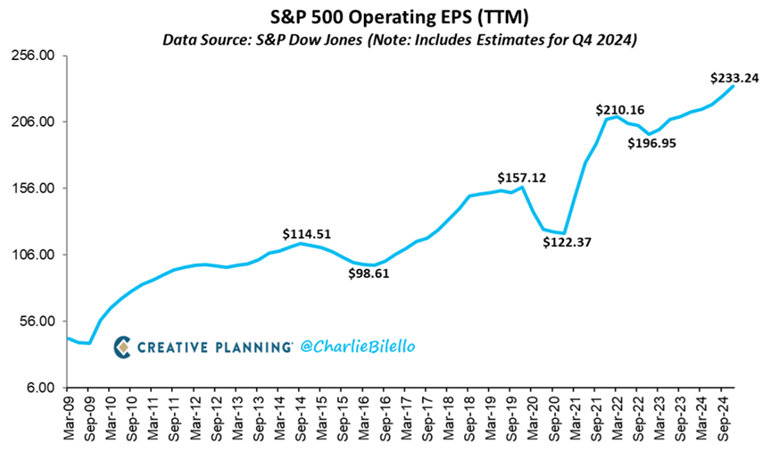
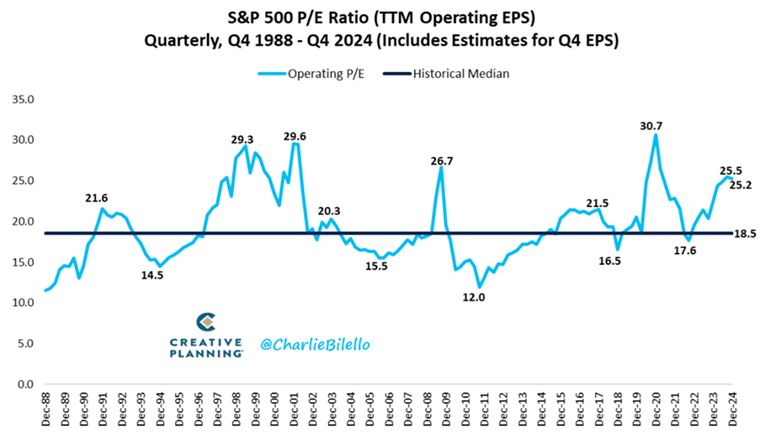
The market rise was aided by the S&P 500’s price to earnings (P/E) ratio moving up to 25.2x at year-end from 22.3x at the start of the year.
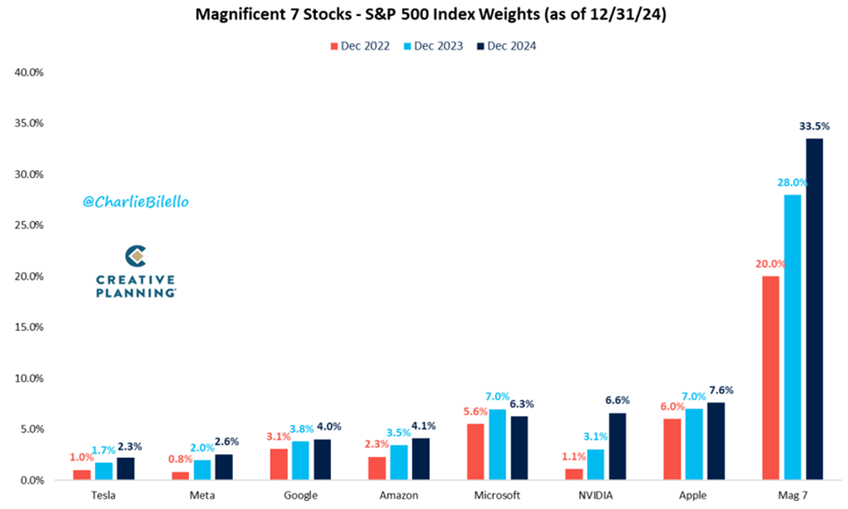
The ‘Magnificent Seven’ technology stocks helped the S&P 500 to new highs. They went up an average 61% in US dollar terms, compared to a 25% rise in the index (+37% in AUD terms).

Nvidia led the charge, up a stunning 171%, as expectations for AI demand soared. Following Nvidia was Meta, rising 66%, and Tesla, 63% higher. Microsoft was the laggard of the bunch.
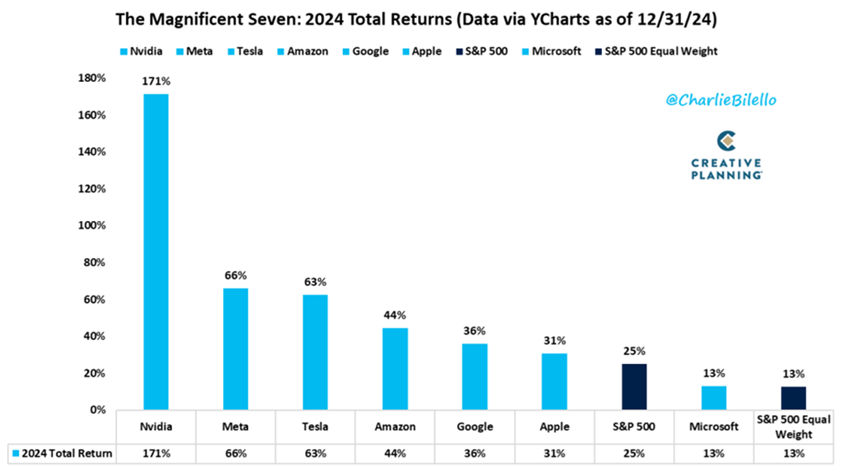
The Magnificent Seven now accounts for 34% of the S&P 500, up from 20% just two years ago.
The other big winner from 2024 was the Aussie banks. The ASX financials sector ex-REITs leaped 34%, surprising many investors. Westpac was best, up 41%, followed by heavyweight, CBA, 37% to the better.

The amazing thing about the banks’ performance was that their earnings last year went backwards, so their share price performance was entirely driven by multiple expansion. For instance, CBA is now the most expensive bank in the developed world, trading at 27x trailing earnings. That compares to America’s largest bank, Bank of America, which has a price to-earnings (P/E) ratio of 16x.

The Australian banks were obviously helped by a rotation out of the miners, which suffered from China’s economic slowdown. That rotation has slightly turned in 2025, with miners starting to find some love.

The other strong performer was the REITs. That may be a headscratcher for some, given the plight of the office and retail property sectors last year. However, Goodman Group accounts for almost 40% of the ASX 200 REITs index, and it rose 75% in 2024, thanks to excitement over its growing data centre portfolio.

Meanwhile, the ASX 200 increased 7% last year, and 11% including dividends. It was a decent enough year, albeit badly lagging the likes of the US. The main reason for being a laggard is that earnings barely grew in 2024 as the economy stalled.

The losers in 2024

The Australian miners were the biggest losers last year, dropping 15%. It didn’t help that the price of our biggest mining export, iron ore, fell 28%. That resulted in resource majors, BHP and Rio Tinto, declining by 22% and 18% respectively.

Some of the biggest losses were in the lithium sector, as the lithium price went down a further 22% in 2024. That led to IGO, Pilbara Minerals, and Mineral Resources, sinking 43%, 45%, and 51%, respectively.

The other loser from last year was Australian Government bonds. The bonds went up 2.3% though lost money in real terms as they trailed the rate of inflation. Bonds are entering their 5th year of a bear market, with 2025 delivering more bad news so far.

The best over a decade

One year is just one year, and it’s often best to zoom out to get a better picture of asset class returns.

Over the past 10 years, the standout performers have been US and international shares. The S&P 500 has returned 16% per annum in Australian dollar terms. America has had an amazing run since the financial crisis, with the index up 8.8x, and almost 10x including dividends, since bottoming in March 2009 at 666. Almost a 10-bagger over 15 years!

The US has helped international shares ex-Australia return 13% p.a. over the past decade. America now accounts for 75% of the MSCI World Index – it’s now a case of where the US goes, the world goes.

Australia has trailed US and international shares badly over the past 10 years, rising 8.5% p.a. That’s well below its long-run return of close to 10%. The banks have dragged on the index, despite a better 2024, due to tepid earnings growth.

Surprisingly, at least to me, is that miners have beaten the ASX 200 since 2015. That’s because the resource companies had a sharp downturn from 2012 to 2014 as commodity prices swooned, but they’ve since somewhat recovered.

Bonds and cash over the decade have been poor investments, largely due to the low interest rates that prevailed up to 2022.

Meanwhile, gold has not only been a solid short-term performer, but a longer term one too. It’s returned 11% p.a. during the past decade. That’s better than Australian shares over the period.

What do past returns tell us about the future?

Unfortunately, the asset class returns of the past year and decade don’t tell us a lot about what will happen during the next 10 years. They can give little clues, though.

US shares have clearly had an extraordinary run and look expensive, at 1-2 standard deviations above historical norms on most valuation metrics.
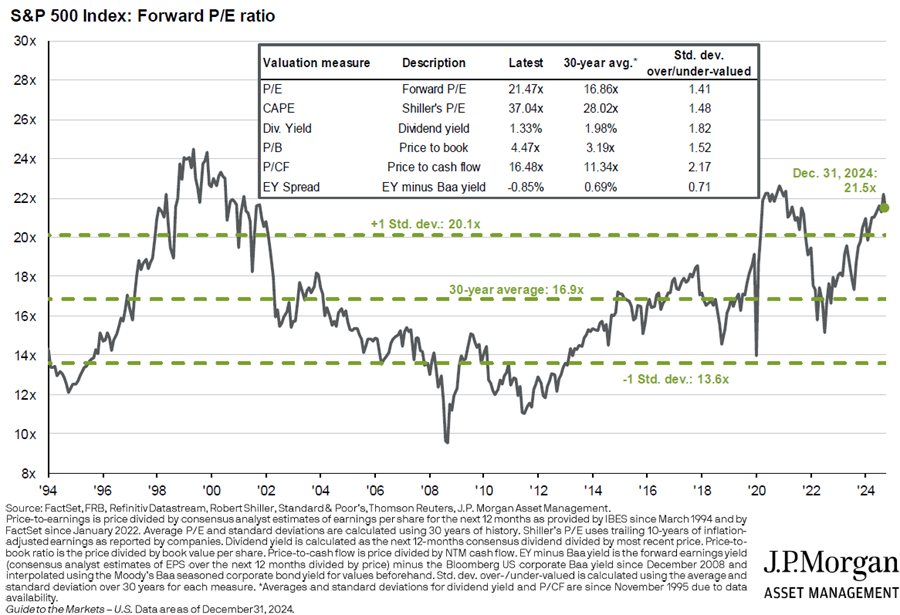
Current valuations for American don’t augur well for future returns.
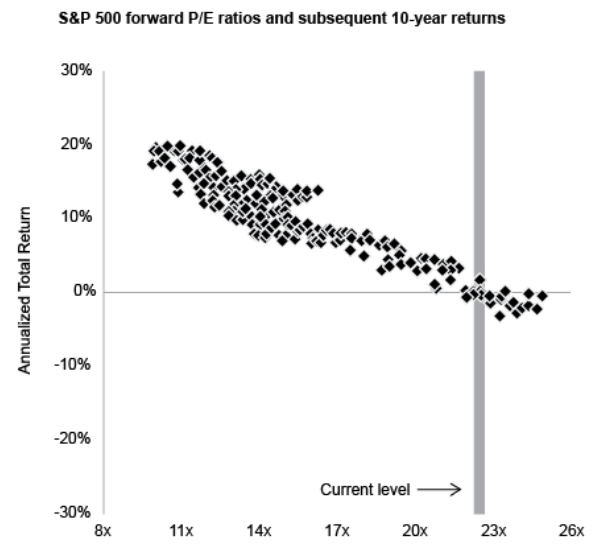

Source: JP Morgan

Unfortunately, most other developed markets, including Australia, also trade at higher than average multiples. It would surprise if banks didn’t pull back from recent highs, unless they can generate some decent earnings growth. If the Big Four don’t perform, it will be up to the resource companies to pick up the slack. And that will depend on commodity prices, whose future is always difficult to predict.

Bonds are offering greater competition to equities, with 10-year yields approaching 5%. Those yields should result in better returns for bonds over the next decade than the paltry ones delivered in recent years.

Gold has had a great run, though given its history of boom and bust, it seems unlikely to repeat that performance over the next 10 years.

What about alternative assets? Private equity and private debt have become increasingly important in the portfolios of super funds and other institutional investors. And of late, they have delivered commendable performance. Yet, they haven’t been fully tested in times of steeply rising bond yields and/or deteriorating credit quality. That said, listed and unlisted infrastructure looks more interesting.

I’m often asked about Bitcoin. I briefly wrote about it and copped some backlash from enthusiasts. None of them have rebutted my critique that Bitcoin is yet to prove useful for anything barring speculation. If it becomes useful in the real world, I might change my mind. Until then, I can’t advocate it for investor portfolios.

What should investors do with their portfolios?

Given this context, what should you do with your portfolio? Probably the worst thing that you can do is overreact to the past performance of assets and make wholesale changes to your portfolio. Tinkering perhaps, but radical surgery is usually unwise.

One of the best strategies to implement is re-balancing. I talked about this in a previous article on building a portfolio.

Say you’ve got a 60/40 equities/bonds portfolio, with a 70/30 split between international and Australian shares. Perhaps that split is now 75/25, given the recent outperformance of international stocks. Rebalancing back to 70/30 can make sense.

Research has shown that rebalancing every year or two, or when certain assets reach a certain percentage of a portfolio, improves investment performance in the long term. The reason for this is that rebalancing is essentially a value strategy: it switches out of outperforming, and possible expensive, assets into cheaper ones.

What if you’re worried about the future and expect a sharp downdrift in stocks? Again, overreacting can be a mistake. It’s handy to remember that Australian shares go up about four out of every five years on average. Therefore, if you’re a pessimist, the numbers are against you.

That doesn’t preclude buying some more defensive shares, if you’re that way inclined. Defensive ASX stocks such as Woolworths, Endeavour, and Lotteries Corp are offering better value than a lot of other Australian companies at present.


James Gruber is Editor at Firstlinks.


25 Comments
Vic
January 19, 2025

Hi James,
What was not mentioned was the Information Technology Sector (XIJ). This sector outperformed the global ETF IOO for the last 10 months of 2024. This global ETF is a good benchmark to measure other indices or stocks and has outperformed all our ASX indices for the last five years. The Info Tech Index was up 50% in 2024. Stocks within that sector did very well.

regards Vic

Simon
January 19, 2025

Hi,
I asked Anthropic's Claude Ai the following: In Australia over the last 30 years what was the best performing asset?

Gold (AUD):

Starting price (1994): ~$450 AUD/oz
Price in early 2024: ~$3,000 AUD/oz
CAGR: Approximately 7-8%
Notable periods: Strong performance during 2008 GFC and 2020 pandemic

Silver (AUD):

Starting price (1994): ~$7 AUD/oz
Price in early 2024: ~$35 AUD/oz
CAGR: Approximately 5-6%
More volatile than gold but generally lower returns

ASX 200:

Launched in 2000 (using All Ords for pre-2000 data)
Starting value (1994): ~2,000 points
Value in early 2024: ~7,600 points
CAGR: Around 6.5% (excluding dividends)
With dividends reinvested: Approximately 9-10% total return

Housing:
Sydney/Melbourne:

Median price 1994: ~$150,000
Median price 2024: ~$800,000
CAGR: Approximately 8-9%
Additional rental yields of 3-4% per year

Gold Coast:

Median price 1994: ~$120,000
Median price 2024: ~$650,000
CAGR: Approximately 7%
Higher rental yields of 4-5% historically
More volatile than Sydney/Melbourne
Notable booms: Late 1990s, 2003-2007, 2020-2023
Notable busts: Post-GFC (2008-2012)

Overall ranking by total return (including income/dividends):

Sydney/Melbourne property (with rental income)
Gold Coast property (with rental income)
ASX 200 (with dividends reinvested)
Gold
Silver

The Gold Coast showed more volatility than Sydney/Melbourne but has generally delivered strong returns, particularly when including rental income. Its performance was more cyclical, with bigger booms and busts tied to tourism, migration patterns, and construction cycles.

I then asked the same question but over the last decade:
Here's the performance analysis for the last decade (2014-2024):
Gold (AUD):

Starting price (2014): ~$1,400 AUD/oz
Price in early 2024: ~$3,000 AUD/oz
CAGR: Approximately 7-8%
Particularly strong performance 2019-2024

Silver (AUD):

Starting price (2014): ~$22 AUD/oz
Price in early 2024: ~$35 AUD/oz
CAGR: Approximately 4-5%
Underperformed gold significantly

ASX 200:

Starting value (2014): ~5,300 points
Value in early 2024: ~7,600 points
CAGR: Around 3.5% (excluding dividends)
With dividends reinvested: Approximately 7-8% total return

Housing:
Sydney/Melbourne:

Median price 2014: ~$650,000
Median price 2024: ~$1,200,000
CAGR: Approximately 6-7%
Additional rental yields of 2.5-3.5%
Major boom 2014-2017 and 2020-2022
Correction in 2018-2019 and 2022-2023

Gold Coast:

Median price 2014: ~$450,000
Median price 2024: ~$850,000
CAGR: Approximately 6.5-7.5%
Higher rental yields of 4-5%
Strongest growth 2020-2023
More stable than previous decades
Benefited significantly from interstate migration

Overall ranking by total return (last decade):

Gold Coast property (with rental income)
Sydney/Melbourne property (with rental income)
Gold
ASX 200 (with dividends reinvested)
Silver

Key differences from the 30-year analysis:

Gold Coast outperformed Sydney/Melbourne
ASX 200 showed lower returns
Gold performed relatively better
Property growth was more concentrated in specific periods
Lower overall returns across all asset classes compared to the 30-year period

Did it get it wrong?


James Gruber
January 20, 2025

SImon,

There's a fair bit wrong with this.

1) My returns in table 1 are to Dec 31, 2024. Your AI fig dates are different.
2) Your analysis is incorrect - on the AI figs, ASX stocks win, with divs included, so not sure why they weren't ranked 1. But again, the dates are different to my table in article.

James

Dan
January 19, 2025

How can anyone justify govt bonds in a portfolio? With a 10yr return of 1.7%pa and cumulative inflation over the same period @35%!
We can’t ignore financial repression.
I think I’ll be lodging a complaint that my adviser hasn’t acted in my best interest.

Philip - Perth
January 19, 2025

The reason so many have held bonds (i.e. have been sold them!) is because we've (all?) been focusing on interest rates falling...but they haven't and perhaps won't, soon and/or much. That became clear to me a couple of years ago and I was howled down, but bond investors in general are smarter than stock investors and for my part, being "wrong" in investing is often simply contrarian thinking rather than following the crowd. I always have some gold exposure (currently about 20% of portfolio via a small shares and a much larger GOLD ETF exposure), because I'm of the view that we're in a bubble (tech, crypto, many stocks and most property are all over-priced by my reckoning) so I'm holding almost 75% in cash. Here's the thing with cash: it's what all investing is about; we aim for cash by holding assets that throw off cash and ultimately we sell them for...cash! Seems to me that the hatred of/distain for cash is manufactured by those selling 'growth' assets. Personally, I only ever have owned my own home, my business premises (when applicable) and my next home - no other property, ever. My thinking is that it needs to be an actively managed asset rather than passive, if you're to avoid all the hidden costs that make it not-so-good in the longer run. And owning stocks is investing in someone else's business, so if you're in business yourself, you'd have to be asked why you're not investing more in your own...? Lastly, observing the pursuit of money provides some fascinating insights into humanity, doesn't it?

Derek Miller
January 19, 2025

Question ,Are the figures quoted for Australian shares and International shares total shareholder returns or simply increase in ASX 200 values . There seems to be some anomalies eg ASX 200 FOR ONE YEAR is 11.4% but increase in index is 10.9% which would make TSR
of around 14.5%
Regards Derek Miller

James gruber
January 19, 2025

Hi Derek,

All figures in first table are tsr.

James

Ian Lange
January 17, 2025

Thanks for the article. I assume the 70/30 split refers to a 70% weighting toward Australian shares ? I'm not sure why you would want to weight yourself so heavily to the Australian market. I understand home bias, but I would have thought such a heavy weighting is quite risky for a small economy with an unstable currency. I am personally weighted in favour of international shares, mostly held in Vanguard ETF's. I really can't see any reason for Australian outperformance in the future, given our focus on exporting raw materials, with pretty much no value add. That said, with the AUD doing so poorly, now is probably not the best time to be buying outside Australia.

SRH
January 17, 2025

I think the article says 70/30 international/domestic, which is reinforced by the comment on rebalancing, though I must say most SMSF portfolios would be other way round.

I’m intrigued as to how you wrote this article tomorrow. Joke.

Graham W
January 17, 2025

Interesting that gold gets a mention. As gold holds its value over time and is said to have increased by 11 percentage over the last ten years. I would say that inflation was also 11 percent over the last ten years. So it has kept up with inflation like it has for ever. Should be the cornerstone of every portfolio

Peter Care
January 19, 2025

Gold holds its value over time? Really? In1980, I could have purchased gold @ $800 US per ounce. Today, 45 years later it is $2.700 US per ounce. That does not even cover inflation, it pays no income and for most people there. are costs in storing it.
I would not describe that as holding its value over time. To me that feels more like going backwards.

SB
January 19, 2025

1980 a random choice of date? ATH , how about 1999 ATL as a base

Graham W
January 20, 2025

Thirty years ago 400 ounces of gold would buy a house in Sydney. The inflationary increase in house prices has been well above official inflation rates but the same 400 ounces of gold will still buy the house in Sydney. Good enough for me.

Steve
January 17, 2025

Equal weight ETF's automatically rebalance, within the said ETF class. Also something like MOAT ETF which has alot less exposure to the mag 7 and is value based.
Last, I always find these stories interesting when the Morningstar market valuation measure sits currently at 1.07 for Aus shares and 1.02 for the US!! Can you explain the disconnect between the Morningstar valuation which says the market is a tad over-priced but reasonable, and the woe is me narrative so prevalent?

James Gruber
January 17, 2025

Steve,

Firstlinks is owned by Morningstar but our views are independent of it.

James

Steve
January 17, 2025

Thanks James, I do get the independent views etc but I would find it helpful if someone could explain how Morningstar can calculate the market fair value as not along way off the current price (just 2% "overvalued" for the US and 7% for Australia). Using metrics like P/E ratios, CAPE, P/B in the article the S&P can be argued as 30-40% overvalued, which is more in line with the tone of the article. But one can argue the high weighting to growth stocks pushes these metrics up. It's a bit of a head scratcher to be honest. Personally it would be more reassuring if we could get some understanding of how the Morningstar valuations are calculated. Might be a good story in its own right.

James Gruber
January 17, 2025

Hi Steve,

Yes, I must confess that I don't even know how Morningstar calculates that fair value. I'll come back to you.

James

John Donald
January 20, 2025

Please do. I've been puzzled for a long time as well

James Gruber
January 20, 2025

Hi Steve and John,

I've got an answer for you.

The fair value estimate for the market is derived from bottom up estimates of company fair values from Morningstar analysts. Morningstar covers all companies in the ASX 200 and has a fair value for each of them. The fair values are aggregated (according to market weightings) and compared to the current price.

Now, where it may get slightly confusing is that Morningstar also puts out a quarterly market report which has a market fair value that may differ from the website. That's because the market outlook's fair value is bottom up, but equal weighted rather than market cap weighted. Again though, it is comes from analyst fair value estimates for companies.

Hope that makes sense.

James

Steve
January 22, 2025

Thanks James, it shows the methodology which is not really unexpected given how Morningstar values companies. But it still does not explain why the valuation placed on these businesses (as a whole, ie the market) is quite close to the current market valuation, when other metrics like CAPE, P/E, P/B etc suggest "the market" is overvalued? If the CAPE for the market as a whole is high, surely the underlying components would be high as well? Still scratching my head!

James Gruber
January 22, 2025

Hi Steve,

The simplest way to explain it is that Morningstar is primarily bottom up, while most others, especially brokers, are top down. I used to work at a broker and it, like most brokers, set a market target price and upside, and got sector and company earnings to match that top down figure. It often required a lot of finessing.

My understanding of Morningstar is that it operates differently and, as mentioned, the fair value for the market is derived principally from company price targets. Morningstar doesn't really have things such as market targets, market earnings forecasts, market PER forecasts, and it doesn't link these into economic forecasts like GDP, inflation etc.

Personally, on both the sell and buy sides, I never took market targets too seriously, but that may be a story for another day.

James

Philip - Perth
January 16, 2025

Firstly, thank you for a well researched and argued article. Having said that, I tend to agree with Mark's comments above, especially his comment on 'point to point analysis' although I'll not pull my punches as he did. Your teaser headline failed to deliver in the article. What (do you think) is the "perfect portfolio" for the next decade? We're still waiting. The answer - of course - would be to hold only the best performing asset, but being realistic, what do you actually believe? 'Rebalancing' from what to what? Readers would like to know what you think...or at least this one would. Personally, I favour a more heavily cash-weighted approach (anchor the portfolio with an admittedly lower return but lower risk, up to 75% in cash if I'm really bearish...) and then a small mix of concentrated 'best picks' which I might monitor closely with Stop Loss and (my own invention) Profit Points to further trim risk. My own portfolio delivered 'only' a shade below 12% for 2024, which is less than the almost 14% that many portfolios holding only 5% and the 'standard' mix of assets would have delivered, but I'm happy with that. Under-perfomance at far reduced risk of loss is my expectation. I believe that word needs to be entered into the conversations we have, far more than it is. What are people's expectations and how can they (sensibly) achieve them? That's something your readers might really want to know, because in my 45 years' of experience in advice I have found that most people start with an assumption (expectation) of a rate of return, rather than an asset allocation, as their 'anchor'. Not necessarily the smartest way to go, but definitely the most common approach. Just sayin'...

James Gruber
January 16, 2025

Hi Philip and Steve,

Agree - it needed a different title.

James

Steve
January 16, 2025

The breakdown of past performance is interesting and the risks of overvalued asset classes too. However this article completely fails to deliver on the title.

Mark Hayden
January 16, 2025

Short-termism dominates investment analysis, so it is great to read some longer-term aspects included. I note the 10 year column has some exceptional numbers which I term the Folly of Point to Point analysis. Hence rolling 10 year numbers, or adding 20 year numbers may be useful. The commentary on rebalancing is good; if the specified asset mix is good, then rebalancing forces, at least partially, a sell high and buy low strategy.


Leave a Comment:

RELATED ARTICLES

Creating a bulletproof investment portfolio

The challenges of building a portfolio from scratch

Why I'm a perma-bull on stocks

banner

Most viewed in recent weeks

Australian stocks will crush housing over the next decade, one year on

Last year, I wrote an article suggesting returns from ASX stocks would trample those from housing over the next decade. One year later, this is an update on how that forecast is going and what's changed since.

What to expect from the Australian property market in 2025

The housing market was subdued in 2024, and pessimism abounds as we start the new year. 2025 is likely to be a tale of two halves, with interest rate cuts fuelling a resurgence in buyer demand in the second half of the year.

Howard Marks warns of market froth

The renowned investor has penned his first investor letter for 2025 and it’s a ripper. He runs through what bubbles are, which ones he’s experienced, and whether today’s markets qualify as the third major bubble of this century.

The perfect portfolio for the next decade

This examines the performance of key asset classes and sub-sectors in 2024 and over longer timeframes, and the lessons that can be drawn for constructing an investment portfolio for the next decade.

9 lessons from 2024

Key lessons include expensive stocks can always get more expensive, Bitcoin is our tulip mania, follow the smart money, the young are coming with pitchforks on housing, and the importance of staying invested.

The 20 most popular articles of 2024

Check out the most-read Firstlinks articles from 2024. From '16 ASX stocks to buy and hold forever', to 'The best strategy to build income for life', and 'Where baby boomer wealth will end up', there's something for all.

Latest Updates

Investment strategies

The perfect portfolio for the next decade

This examines the performance of key asset classes and sub-sectors in 2024 and over longer timeframes, and the lessons that can be drawn for constructing an investment portfolio for the next decade.

Shares

The case for and against US stock market exceptionalism

The outlook for equities in 2025 has been dominated by one question: will the US market's supremacy continue? Whichever side of the debate you sit on, you should challenge yourself by considering the alternative.

Taxation

Negative gearing: is it a tax concession?

Negative gearing allows investors to deduct rental property expenses, including interest, from taxable income, but its tax concession status is debatable. The real issue lies in the favorable tax treatment of capital gains. 

Investing

How can you not be bullish the US?

Trump's election has turbocharged US equities, but can that outperformance continue? Expensive valuations, rising bond yields, and a potential narrowing of EPS growth versus the rest of the world, are risks.

Planning

Navigating broken relationships and untangling assets

Untangling assets after a broken relationship can be daunting. But approaching the situation fully informed, in good health and with open communication can make the process more manageable and less costly.

Beware the bond vigilantes in Australia

Unlike their peers in the US and UK, policy makers in Australia haven't faced a bond market rebellion in recent times. This could change if current levels of issuance at the state and territory level continue.

Retirement

What you need to know about retirement village contracts

Retirement village contracts often require significant upfront payments, with residents losing control over their money. While they may offer a '100% share in capital gain', it's important to look at the numbers before committing.

Sponsors

Alliances

© 2025 Morningstar, Inc. All rights reserved.

Disclaimer
The data, research and opinions provided here are for information purposes; are not an offer to buy or sell a security; and are not warranted to be correct, complete or accurate. Morningstar, its affiliates, and third-party content providers are not responsible for any investment decisions, damages or losses resulting from, or related to, the data and analyses or their use. To the extent any content is general advice, it has been prepared for clients of Morningstar Australasia Pty Ltd (ABN: 95 090 665 544, AFSL: 240892), without reference to your financial objectives, situation or needs. For more information refer to our Financial Services Guide. You should consider the advice in light of these matters and if applicable, the relevant Product Disclosure Statement before making any decision to invest. Past performance does not necessarily indicate a financial product’s future performance. To obtain advice tailored to your situation, contact a professional financial adviser. Articles are current as at date of publication.
This website contains information and opinions provided by third parties. Inclusion of this information does not necessarily represent Morningstar’s positions, strategies or opinions and should not be considered an endorsement by Morningstar.