In the 2020 Federal Budget, Treasurer Josh Frydenberg delivered a surprise for the superannuation industry. He announced the introduction of a ‘Your Future, Your Super’ package, which included:
“members will have access to a new interactive online YourSuper comparison tool which will encourage funds to compete harder for members’ savings.”
The full 40-page explanatory document is here and the fact sheet summary is here, including:
“By 1 July 2021, MySuper products will be subject to an annual performance test. If a fund is deemed to be underperforming, it will need to inform its members of its underperformance by 1 October 2021. When funds inform their members about their underperformance they will also be required to provide them with information about the YourSuper comparison tool. Underperforming funds will be listed as underperforming on the YourSuper comparison tool until their performance improves. Funds that fail two consecutive annual underperformance tests will not be permitted to accept new members. These funds will not be able to re-open to new members unless their performance improves. By 1 July 2022, annual performance tests will be extended to other superannuation products.”
How do we measure underperformance?
Objective measurements of super fund performance have practical limitations that make comparisons difficult. Changing funds based on these results will deliver unpredictable and even counterproductive consumer outcomes. As the MySuper Product Heatmap already produced by the Australian Prudential Regulation Authority (APRA) shows, comparisons and disclosures are difficult to understand. Most people will struggle with the most basic aspects of adjusting performance for risk.
On disclosures, the Australian Securities & Investment Commission (ASIC) recently stated:
"Disclosure cannot solve complexity that is inherent in products and processes. Simplifying disclosure, for example, does not reduce the underlying complexity in financial products and services. Nor does it ease the contextual and emotional dimensions of financial decision making, both at the point of purchase and over time."
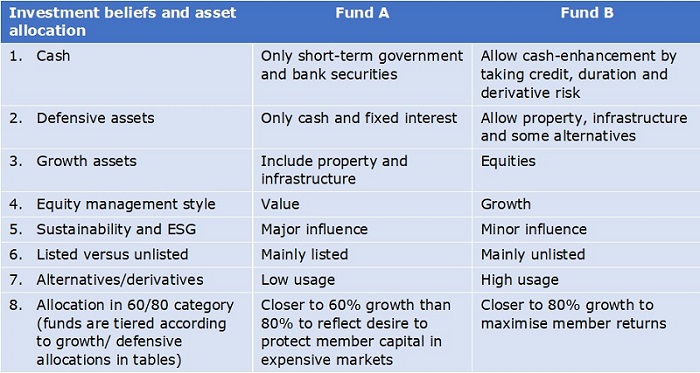
Let’s take a simple example of two super funds, Fund A and Fund B, which sit in the same risk bucket of 60% to 80% growth. Both are managed by well-qualified, experienced teams offering diversified asset allocations designed to maximise returns over the long run.
Here are the views of both teams in managing their funds.

Each of these choices can influence the outcome depending on market conditions. Treasury has indicated fund performance will be measured over eight years, but factors can have long cycles which look favourable until the market turns.
Defensive versus growth assets
There is no industry standard on the definition of growth or defensive assets (although a team is working on it). Some argue that since infrastructure assets have guaranteed long-term cash flows, often linked to inflation and government contracts, they have strong defensive characteristics like fixed interest. Furthermore, unlisted assets are not subject to the daily vagaries of stock market valuations and therefore have far greater price stability.
For example, Hostplus states:
“Unlisted assets – including infrastructure, property and private equity – continue to provide important downside protection as they are not directly linked to equity markets.”
APRA's heatmap on Hostplus assessed its MySuper product as having a 93% allocation to growth assets, despite the fact it is usually in the 60% to 80% section in league tables. Hostplus argued 93% was misleading because some of its defensive assets had been placed into growth by APRA.
Clearly, if risk markets are doing well, a fund with higher allocation to ‘growth’, such as at the 80% end rather than 60% end of the 60/80 spectrum, will do well in a performance comparison. But they are simply taking more risk, they are not managed better.
Then when the market struggles, such as in March 2020, the defensive funds benefit. Some super funds were forced to revalue their unlisted assets to ensure prices more accurately reflected the poorer outlook. Who could claim an unlisted airport had not fallen in value after COVID-19 when listed airports had halved in price?
Contrast Hostplus with the approach taken by UniSuper, which writing to its members in March 2020 advised:
“We have a relatively low exposure to unlisted assets in our diversified options (about 7% for the Balanced option). We think of property and infrastructure as ‘growth’ assets so they don’t qualify for inclusion in our defensive allocation.”
When superannuation funds take such varying approaches to defensive and growth definitions and allocations, their risks and performance are difficult to compare.
Growth versus value style
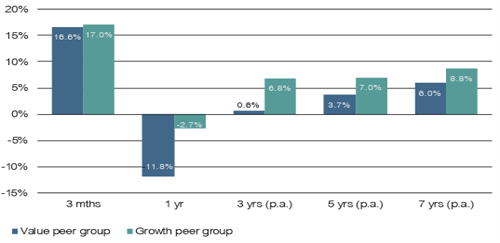
It’s the same across a wide range of investment beliefs. In equities, ‘value’ versus ‘growth’ investing is a classic example. Historically over long time periods, value had outperformed growth, and many of our leading fund managers have built their businesses arguing that buying value companies below their intrinsic value are better investments than growth companies at high Price to Earnings (P/E) ratios. But as the table below shows for the Australian market, over the three years to 30 June 2020, growth outperformed value by over 6%. Over one year, growth was worse by 9%.
Neither is wrong and both have their day. There are performance differences based on where we are in the market cycle, not ‘underperformance’. The Government’s proposal could lead to a super fund informing its members of its inferior performance just as the cycle turns in its favour.
Lonsec value versus growth peer group performance to 30 June 2020

Leading research house Lonsec says about the outperformance by growth over three to seven years:
“But how long can this run last? Dispersion between these two styles has not been this high since just before the tech wreck at the turn of the millennium, which saw value overtake growth as the predominant style ... This begs the question: Are we due for another correction?”
When will the market fall out of love with tech stocks and return to more fundamental industrial stocks? Probably after the YourSuper comparison tool gives the wrong signal.
Many factors influence performance
We could go on. A fund manager may take a strong sustainability position against fossil fuels just as oil prices rise rapidly. Should they be punished for saving the world? Another fund may hold government bonds in its defensive allocation as interest rates rise rapidly, losing their defensive characteristics in the comparison period. Of course, the bond will repay at par on maturity but by that time, the damage is done.
At industry funds, insurance arrangements for members are often unique to the relevant industry, and cheaper than comparable insurance in the public market. For example, many Mine Super (formerly Auscoal) members are miners who need protection in a risky industry, and the fund has negotiated attractive group prices. What happens with insurance when an apprentice coal miner starts work if Mine Super is unable to accept new members?
The fear is that superannuation fund trustees become so worried about the fund closing to new members and the shame of public underperformance that they stop the investment team backing its views. The CIO who decides the market outlook is poor and wants to take a more defensive position to protect member capital may be prevented from doing so or be forced to reverse a position if timing is wrong in the first year. The trustees who cannot tolerate the poor results will push the CIO to return to industry risk-weighting, or switch to passive management to ensure close-to-market performance.
It is common for a fund manager to lead the league tables over one period and be bottom of the pile over another, and few stay in the top tier over all periods. Some hog the index because business survival is often more important than market performance.
Will this performance tool have an impact?
The Budget announcement says:
“By 1 July 2021, MySuper products will be subject to an annual performance test. If a fund is deemed to be underperforming, it will need to inform its members of its underperformance by 1 October 2021.”
So the underperformance measurement is operating now, it does not begin on 1 July 2021 as some commentators are saying.
Back to ASIC's comments on disclosure:
"When disclosure is used to address problems it is ill-suited to solve, it can place an unrealistic and onerous burden on consumers – for example, expecting them to overcome complexity and sophisticated sales strategies.
Like other forms of regulation, mandated disclosure requirements are often ‘one size fits all’ interventions – yet people and contexts differ and shift. It is hard to predict the individual and context-specific differences in how we will behave, make decisions, and engage with and process information."

Here are the Government claims for this initiative:
- A typical young Australian entering the workforce in their 20s could be around $87,000 better off at retirement.
- A typical Australian already in the workforce at age 50 could be around $60,000 better off at retirement.
- A typical Australian spending their working life in the worst performing MySuper product would be up to $98,000 worse off at retirement.
The Government’s announcement includes:
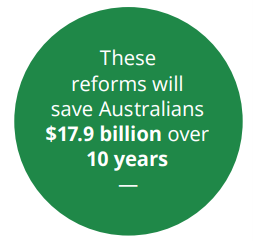
“Once implemented, these measures will benefit Australians by $17.9 billion over the next 10 years. Our $3 trillion superannuation system is responsible for managing the retirement savings of 16 million Australians. The current system is letting too many Australians down. Australians are paying $30 billion per year in superannuation fees ...
Aspects of the Government package, such as reducing fund duplication and creating efficiency, are laudable, but the performance comparison part of the $17.9 billion, worth an estimated $10.7 billion, is a political pitch on an unrealistic dream.
Graham Hand is Managing Editor of Firstlinks.