There’s been a lot of angst-ing about house prices over the last few months. It’s more difficult to start for first home buyers and APRA's announcement that it will tighten lending standards is intended to prevent a ‘bubble explosion’.
We don’t think either of the issues are really supported by evidence.
There’s no doubt house prices have had a go-go year. UBS published its annual Real Estate Bubble index last month and Australia has put in a world class performance this year. Sydney’s price increase (17% above inflation) is the third highest of the 25 cities it surveys (Moscow was no 1 with 22%). But over a five-year period, Sydney’s real price increase of around 3% was well below average, and on other affordability measures, Sydney is more affordable than most of the other 25 cities.
Prices versus servicing
We agree with Saul Eslake (see his Firstlinks article) that first home ownership is an important social construct, and we constantly read headlines about how difficult it is to get into the market (compared to when Boomers were young). The data doesn’t support this. Much of the commentary about the lack of affordability looks at the Price to Income ratio but this ignores the effect of lower interest rates on servicing burdens.
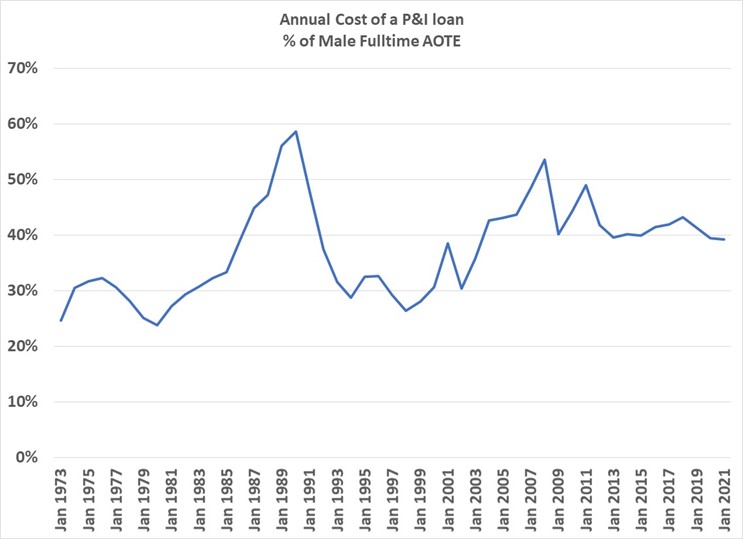
We’ve constructed the chart below which shows the cost of an 80% LVR (loan-to-value ratio), 25-year P&I (principal and interest) loan based on home prices and as a percentage of income since the 1970s. We are using ‘averages’ (full time male Average Ordinary Time Earnings - AOTE - and median Melbourne house prices to 2002 and weighted median house prices since then) and we accept all arguments that it’s not a perfect set of assumptions. We suspect the story is much the same if you use your own assumptions.

In a nutshell, we all know that house prices have gone up exponentially since the 1970s, which is the major reason why the house Price to Income ratio has increased. But so have wages (at a rate of inflation+) while interest rates have fallen.
In the simple terms of how much of your income you devote to paying your P&I home loan, it’s not a lot different between now and those sunlit uplands we all read about. Plus houses are better now, so maybe it should be more expensive.
The societal group we should feel most sorry for is that cohort who bought in the late-1980s/early-1990s when interest rates were 15% as they spent their 20s living on three-minute noodles and drinking at cheap pubs so they could afford to service their home loan.
Is APRA really worried?
APRA announced tighter restrictions on lending for new borrowers by requiring higher minimum interest rate buffer on new loans, citing growing increasing financial stability risks and an acceleration in borrowing. This only applies to new loans and the simple chart below demonstrates how incorrect this is.
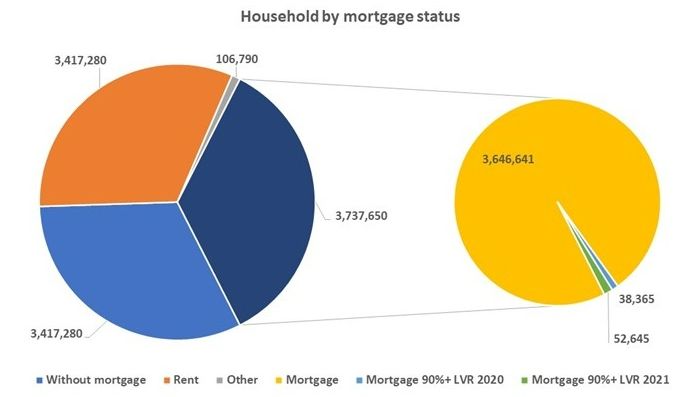
We’ve stratified the total number of Australian homes by tenancy types. The number of households with mortgages (the dark blue segment on the left side), is around 35% of the total number of households (around 10.7 million) and most of the mortgages are old or low LVR.
In the right side of the pie charts below, we have taken the total number of mortgages and slivered out the loans at risk i.e., the number of new loans in FY20 and FY21 at an LVR of >90%. There are around 90,000 of them.
We can’t see existential risk for the Australian financial system arising from less than 1% of the households having marginally increased their risk appetite and maybe borrowed too much. If you look at the number of >80% loans over the past two years, it is 360,000, or just over 3%. Therefore, 97% of Australian mortgage lending is in bulletproof territory.

But what about interest rates going up?
So maybe APRA’s concern about a housing market with increasing prices is that it will create problems when rates increase, and rising defaults and low affordability will result in a death spiral for the housing market and Australian economy. We can’t see any basis for that either.
To put our argument in simple terms: except for the group that have bought over the last few years, everyone else has a loan based on the price when they bought it (say, seven years ago) and rates have halved since then, and there has been income growth.
The parameters are this:
- Only 35% of Australian households have mortgages.
- Only 3% of homes trade per year. The average Australian stays in the one home for over 20 years. We’ve assumed that moving house is the prime driver for increasing or decreasing a mortgage. We also assume that any home equity redraw is offset by others overpaying their mortgage. Clearly younger people move homes and increase mortgages more quickly but you can assume an average seven-year turnover and still come up with unscary numbers.
- Interest rates have fallen materially over the past decade.
- Wages/household income has increased over the past decade.
The result is that the ‘average’ are not at risk of financial stress if rates increase materially.
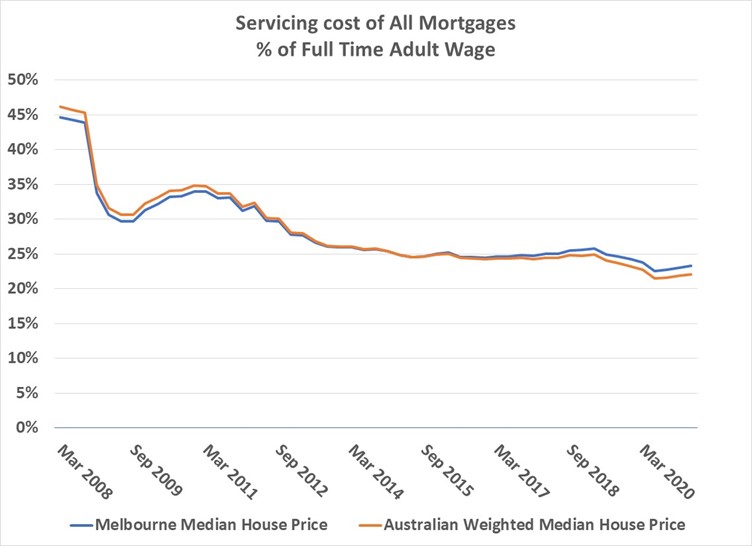
We’ve quantified the numbers in the chart below. The results are the P&I mortgage payments as a percentage of Adult AOTE wages. We’ve assumed that all mortgagees bought their home in 2008 and every year after that 5% a year sold and reinvested in a new home at the next year's median price. We’ve used the actual LVRs for the year of the new purchase. So, in 2020, around one-third of the original 2008 owners are still in their houses, paying a mortgage based on 2020 interest rates and 2008 house prices, and earning a 2020 wage.

The analysis shows that the ‘average’ mortgagee can easily absorb increases in interest rates without posing a systemic threat to the economy or the banking system.
The result is consistent with National Accounts data which shows that households spend around 3% of gross income on household interest, down from 6% in 2008.
Further evidence of the lack of kryptonite in housing lending are the lack of realised losses by lenders. Major bank housing losses over the past three decades are a very small rounding error. Even mortgage insurers, who are the most exposed due to banks requiring borrowers needing an over 80% LVR loan to be mortgage insured, suffer small losses. Average paid losses for Genworth Australia since its IPO are around 30% of the premiums they charge. And they get the worst mortgages as well.
What does it all mean?
We’re a long way from housing price movements causing systemic issues.
Maybe APRA has more data that indicates that issues with the ‘marginal’ homeowner/buyer create outsized problems or maybe APRA thinks that shouting at people creates an effective precautionary firebreak to discourage growth in speculative home borrowing.
In any case, we expect that housing lending will continue to be a profitable and relatively risk-free activity for banks.
On a broader societal issue, APRA should be loosening borrowing standards for some of the population, rather than tightening them. There are still 30% of the population who rent and who would benefit from more certain housing outcomes. Clearly some of them will never be able to own homes, but there are others who just can’t quite get into the market and are marginally higher risk. And building new homes is the best solution to too many renters and high prices, so maybe lending for new home building should be incentivised.
Norman Derham is Executive Director of Elstree Investment Management, a boutique fixed income fund manager. Both Norman and Michelle Morgan are Business Development Managers for the Elstree Hybrid Fund (Chi-X:EHF1). This article is general information and does not consider the circumstances of any individual investor.