The House of Representatives Standing Committee on Tax and Revenue is conducting an inquiry into Housing Affordability and Supply.
This is an issue about which I’ve written and spoken at considerable length for more than 30 years, including a submission to the Senate Economics References Committee’s Inquiry into Affordable Housing in December 2013.
Residential prices outrunning other metrics
Between January 1991 (in the aftermath of mortgage rates rising to an all-time high of 17½% in the late 1980s) and September 2017, Australian residential property prices rose by 313.5%, according to CoreLogic’s now widely-used measure. Over the same period:
- Australia’s population grew by 29%
- average weekly ordinary-time earnings rose for fulltime adults rose by 171%
- the consumer price index rose by 89%, and
- Australia’s economy (as measured by real GDP) grew by 128%.
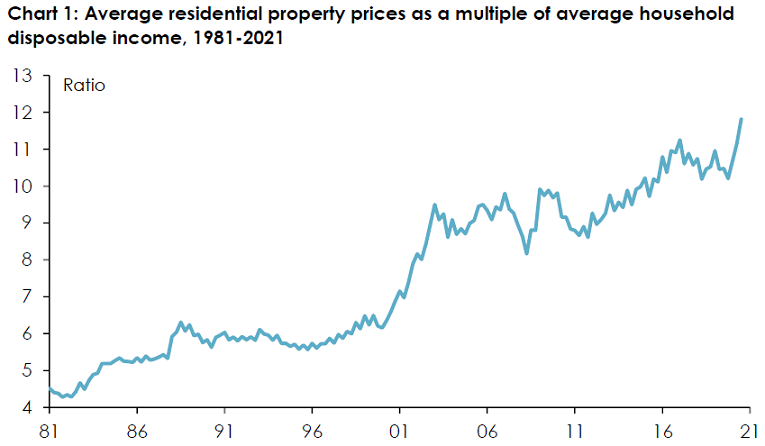
As a multiple of average household disposable income per person aged 15 and over, average residential property prices rose from less than 6 times in the early 1990s to over 11 times by the end of 2017 (Chart 1).

Note: ‘Residential property prices’ are the average of median sale prices across the eight state and territory capital cities; ‘average household disposable income’ is household disposable income divided by the civilian working-age (15 and over) population. Sources: CoreLogic, Home Property Value Index - Monthly Indices; ABS, Australian National Accounts: National Income, Expenditure and Product, March quarter 2021 and Labour Force, Australia, July 2021.
For the roughly 3.2 million Australian households (out of a total of almost 4.5 million) who owned at least one property – and especially for the almost 750,000 Australians who owned at least one investment property – at the beginning of this period, this dramatic escalation in residential property prices was unambiguously a Good Thing.
For the additional 2.2 million Australian households who managed to become homeowners during this period – and again, especially for the just under 2.2 million individual Australians who by the end of it owned at least one investment property (and even more so for the 600,000 or so who owned two or more investment properties) – this huge rise in property prices undoubtedly made them financially better off.
Between the December quarter of 1990 and the September quarter of 2017, the value of household wealth held in the form of residential property rose by almost $5.7 trillion dollars – or 708%. Even after offsetting the $361 billion increase in mortgage debt over the same period, the net value of wealth in the form of residential real estate rose by some $5.3 trillion, or 680%, over this period.
Renters and young people left behind
But for the 1.1 million Australian households (almost one-quarter of the total) who were living in rented accommodation at the beginning of this period – a number which by the time of the 2016 census had risen to almost 2.6 million (or almost 31% of the total) – none of this eye-glazing increase in wealth came their way. The amount they paid in rent increased from $5.7 billion in 1990-91 to $46.4 billion in 2016-17 – an increase of 713%.
Among this almost one-third of Australian households were people who, at the beginning of this period and as it continued, would have expected to have been able to step on to this wealth escalator – only to find that they couldn’t.
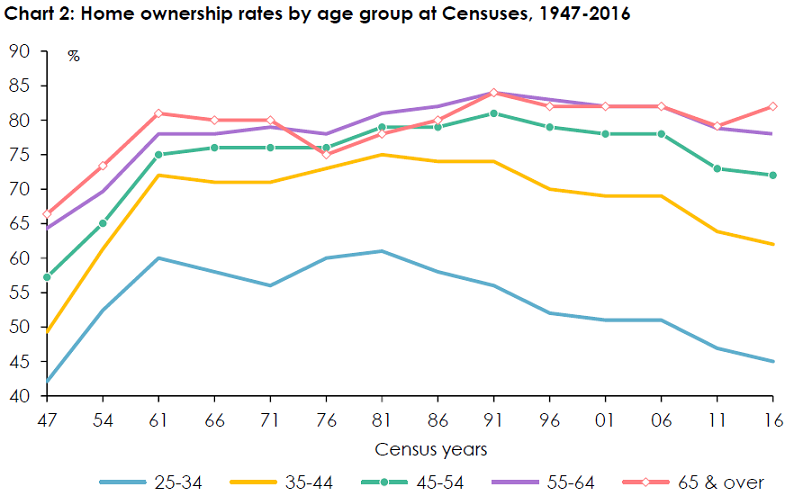
Between the 1991 and 2016 Censuses, Australia’s home ownership rate fell from 68.9% to 65.5% - the lowest it has been since the Census of 1954. But for people aged between 25 and 34, the home ownership rate dropped by 11 percentage points between 1991 and 2016, to a lower level than it had been in 1954, indeed to only 3 percentage points above where it had been in 1947 (Chart 2).

Sources: ABS, Census of Population and Housing: General Community Profile, Australia, 2016 and Historical Census Data; Judith Yates, "Explainer: what’s really keeping young and first home buyers out of the housing market", The Conversation, 12th August 2015, and personal communication.
For people aged between 35 and 44, the home ownership rate dropped by 12 percentage points, to a level just 1 percentage point above where it had been in 1954. Even for people aged between 45 and 54, the home ownership rate at the 2016 Census was 3 percentage points lower than it had been at the 1961 Census, and 9 percentage points lower than it had been in 1991.
Hundreds of thousands of would-be first home buyers – a group for whom politicians of all persuasions routinely profess profound concern – were effectively squeezed out of home ownership by cashed-up immigrants and, even more, by investors able to take advantage of more readily available credit and more generous tax breaks.
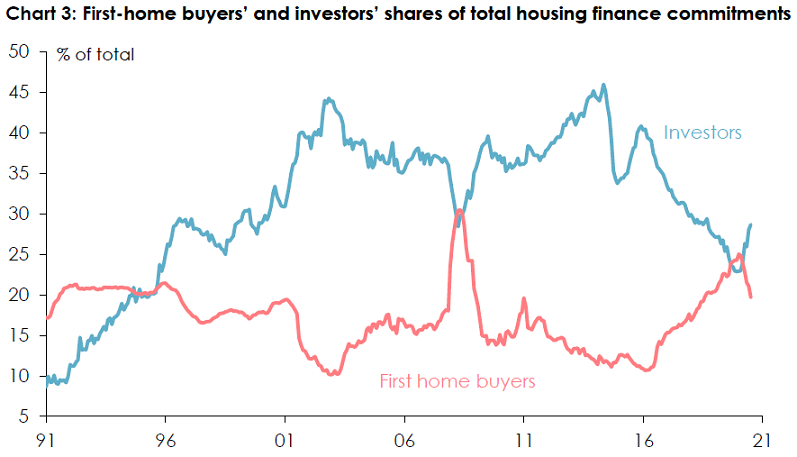
The share of housing finance going to first home-buyers fell from over 20% in the mid-1990s to just over 10% by 2003, and then, following a brief recovery during and after the global financial crisis, fell back down to less than 11% again by the first half of 2017. Meanwhile the share of housing finance going to investors climbed from less than 10% in the early 1990s to over 40% in 2003, and was again back over 40% between mid-2013 and mid-2015, and in the latter part of 2016 (Chart 3).

Sources: ABS, Lending Indicators, June 2021, and Housing Finance, Australia, November 2018.
Prices can fall when policies change
Then, after a series of steps by the financial system regulator APRA to curb some of the more egregiously risky forms of lending to investors that had mushroomed in the first half of the past decade, stricter enforcement of rules pertaining to foreign investment in established properties, and perhaps also in response to expectations that the tax preferences enjoyed by residential property investors would be scaled back in the event of a Labor victory at the federal election due in 2019, residential property prices began falling in Sydney, Melbourne and to a lesser extent Brisbane.
Between September 2017 and May 2019, residential property prices fell by an average of 8.6% across Australia. They fell by almost 15% in Sydney, and by more than 10% in Melbourne – more than they had (in nominal terms) in either city in the recessions of the early 1990s.
Those declines were ruthlessly exploited by the Coalition parties, and by property interests, as ‘evidence’ of what would occur if Labor were to win the 2019 election, and implement its commitments (which it had also made at the 2016 election) to scrap ‘negative gearing’ for all but newly-built investment properties and to reduce the capital gains tax discount – something the Government could do knowing that the number of voters who believed that they benefited from continually rising property prices greatly exceeded the number of voters who saw themselves as ‘missing out’, or losing.
And after a brief revival in the aftermath of the Coalition’s largely unexpected victory at the 2019 election, the onset of Covid-19 in March last year initially prompted a renewed decline in property prices, and widespread speculation (including by all of the major banks) that double-digit percentage declines could be in the offing.
As always happens in Australia whenever it is feared that property prices might fall, governments at all levels and of both major political persuasions moved heaven and earth to ensure that they didn’t. State Governments committed at least $2 billion over two years, and the Federal Government $680 million, to expanded schemes of cash grants or stamp duty concessions to first time buyers. And (admittedly for reasons other than propping up property prices), the Reserve Bank slashed interest rates to new record lows.
Governments to the rescue
And as it always does, it worked. Generous cash grants and tax breaks for first-time buyers ‘brought forward’ demand, funneling it into a relatively short period and allowing those who were able to get to the front of the ‘queue’ to pay more for the homes they bought than they otherwise would – the value ending up in the pockets of vendors or the profit margins of builders and developers. Strongly rising prices then attracted the attention of investors, who could then capitalise on the eagerness of banks and others to lend at record-low interest rates.
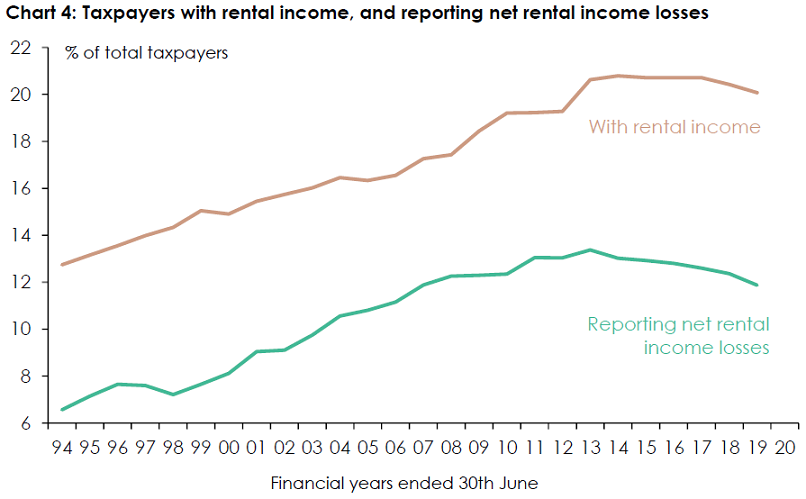
Although ‘negative gearing’ isn’t as attractive a strategy as it once was – given the decline in interest rates – the most recent data from the Australian Taxation Office shows that over 1.3 million individual taxpayers (12% of the total) were still doing it in 2018-19 (Chart 4). They, moreover, are disproportionately high-income earners: 22% of all taxpayers in the top tax bracket (that is, those with taxable incomes in excess of $180,000) were negatively-geared property investors, compared with just 8.6% of those with taxable incomes of $180,000 or less.

Source: Australian Taxation Office, Taxation Statistics, 2018-19.
And data from the banking regulator APRA suggests that mortgage lending standards are again beginning to decline – albeit not yet as egregiously as they had done before 2015. The proportion of new loans being made on interest-only terms has crept up from less than 16% in the last quarter of 2018 to 19¼% in the first quarter of this year. The proportion of new loans being made at loan-to-valuation (LVR) ratios of 80% or more has more than doubled, from less than 14% in the first half of 2018 to over 31% in the first quarter of this year.
Some of that can be explained by the increased proportion of loans going to first-home buyers, who typically have smaller deposits than those borrowing for the second or subsequent home – but not all of it. The proportion of new mortgages being written with LVRs of 90% or more has risen from 6½% in the middle of 2018 to 10½% in the first quarter of this year.
Australia is by no means alone in experiencing an unexpected resurgence in residential property prices in the aftermath of the pandemic.
It’s happening almost everywhere around the world – including in countries which hadn’t seen rapid growth in property prices over the previous two decades, such as Germany. Property prices have more than twice as fast in New Zealand over the past 12 months than they have done on this side of the Tasman – in part because the New Zealand subsidiaries of the Australian banks relaxed their lending standards much more (in response to very strong demand from investors) than they have thus far done here. That’s prompted a strong regulatory response from the Reserve Bank of New Zealand – and a much more dramatic curtailment of tax preferences for property investors than the Labor Party had contemplated for Australia.
The increase in home ownership rates which was achieved over the first two decades of the post-war era – culminating in a peak of 72.5% at the 1966 Census – occurred despite Australia’s population (and in particular the populations of its largest cities) growing at a much faster percentage rate than they have done over the past two decades.
Boosting demand rather than supply
That was possible because, throughout that period, the housing policies of the Commonwealth, state and local governments focussed on boosting the supply of housing – both by building a lot of housing themselves, and by facilitating the construction of housing by the private sector. As a result, despite the strong growth in the ‘underlying’ demand for housing, the ratio of house prices to average incomes remained relatively steady at around three times.
But, starting from 1963, when John Howard (as President of the New South Wales Young Liberals) managed to persuade Sir Robert Menzies to promise cash grants to first home buyers at that year’s federal election, the emphasis of government housing policies has gradually shifted away from boosting the supply of housing, instead to inflating the demand for it.
The (almost inevitable) results of this shift in housing policy have been that house prices have risen to, typically, six or seven times annual disposable incomes; that it now typically requires two incomes to accumulate a deposit and service the mortgage required to buy an average-priced home; and that (as noted earlier) the home ownership rate is now lower than at any time since the mid-1950s (and possibly earlier).
Indeed, it is hard to think of any area of widespread public concern where the same policies have been pursued for so long, in the face of such incontrovertible evidence that they have failed to achieve their ostensible objectives.
Far more votes from property owners
For all the crocodile tears which politicians of all persuasions routinely shed about the difficulties facing those wishing to get their first foot on the property ladder, deep down they know that there are far more people who already own at least one property (and who therefore have a very strong interest in policies which result in continued property price inflation) than there are who don’t, but who would like to (and who would prefer, at least until they succeed in their aspiration, policies which would restrain the rate of property price inflation).
And, sadly, there’s no reason to think that political calculus is going to change. Nor, therefore, are the housing policies which have resulted in created the housing system which Australia has today.
Saul Eslake is an Economist and Principal of Corinna Economic Advisory. This paper was a submission to the House of Representatives Standing Committee on Tax and Revenue’s Inquiry into Housing Affordability and Supply, 25 August 2021. Published with permission of the author.