Register For Our Mailing List

Register to receive our free weekly newsletter including editorials.

Home / 564

How not to run out of money in retirement

Today’s story looks at two key factors that determine the answers to the big questions when planning retirement finances: ‘How much do I need?’, and ‘How much can I afford to spend?’ - in order to have confidence that you can maintain your living standards, not run out of money, and not have to rely on welfare.

These two factors are: your current age, and your likely life span. In particular, we highlight the four big problems when relying on ‘life expectancy’ tables that are used throughout the financial advice and retirement industry.

The bottom line: be prepared for the real possibility of living a lot longer than you might have thought!

‘Median life expectancy’ tables

Most retirement planning calculators provided by government services, super funds, banks, and product issuers, are based on the assumption that you will run down your capital during your lifetime. (They also assume you will be relying on government welfare, as do two thirds of all retirees in Australia, when you run out of money).

The Australian Bureau of Statistics (ABS) publishes Australian life expectancy tables regularly. Here are the most recent life expectancy numbers for Australians (ABS report):
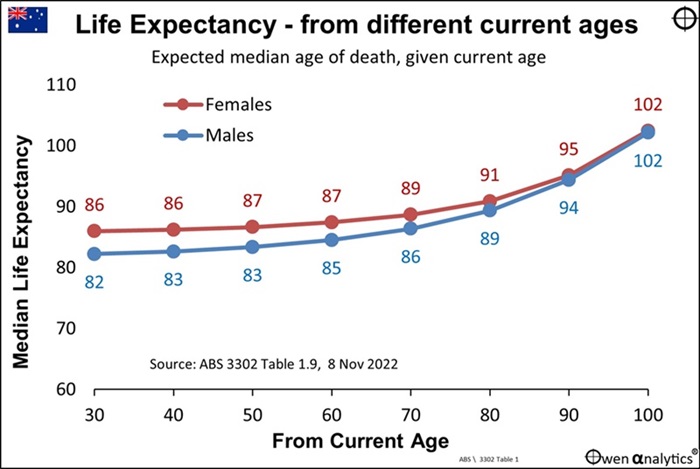
From this we can see, for example, that for people who are now 60, the life expectancy for males is 85 (ie 25 years of life left), and 87 for females (27 years left). This sounds depressing - I certainly hope to live a lot longer than that if I can.

There are four big problems with relying on median life expectancy tables like these to estimate how much capital you will need in retirement, and how much you can afford to spend.

Problem 1 – there is at least a 50% chance you will live longer than the ‘median’

Statistical life tables show ‘median’ life expectancy. Every 60-year-old alive today will not suddenly die when they are 85 for males, or 87 for females. Some will die tomorrow (unfortunately), and some will live well past 100.

The term ‘median’ means ‘middle’. That means that half of all today’s 60-year-olds are projected to die before the median life expectancy, and half will live longer than the median life expectancy.

If you use the median life expectancy as the forecast term of your retirement fund, there is a 50% chance you will fall short, because there is a 50% chance you will live longer than the median life expectancy for your age group.

A 50% probably of failure of your retirement investment plan is far too high for comfort. It would be much safer and more comforting to plan for your funds to last say 15 or so years longer than the median life expectancy tables indicate. We all know, or know of, people who lived past 90 or 100. What if that is us? We can’t suddenly decide to ‘work longer, or ‘go back to work’ or ‘save more’.

Problem 2 – The older you get, the longer you are likely to live

Take another look at the first chart. We can see that the median life expectancy for 60-year-old females today is 87. But the median life expectancy for 70-year-old females today is 89, the median life expectancy for 80-year-old females today is 91, and the median life expectancy for 90-year-old females today is 95, and so on.

The longer you live, the longer you are likely to live. And these are just the medians. Half are expected to live longer than the medians. We take this further below.

Real possibility you or your partner might live to 100 or more

Whenever I talk to investors about financing their retirement, I always insist on both partners being present at every meeting (even if one of them has taken responsibility for ‘looking after the money’). I always say to them:

“One of you might live to 100, and [as I look to the male] it’s probably not going to be you!”

The first chart above is based on ‘medians’, but the next chart spreads life expectancy over the full gamut of possible outcomes.

It shows survival probabilities (vertical axis) and survival ages (horizontal axis) for three cohorts – current 20-year-olds (pink), current 60-year-olds (blue), and current 80-year-olds (green).
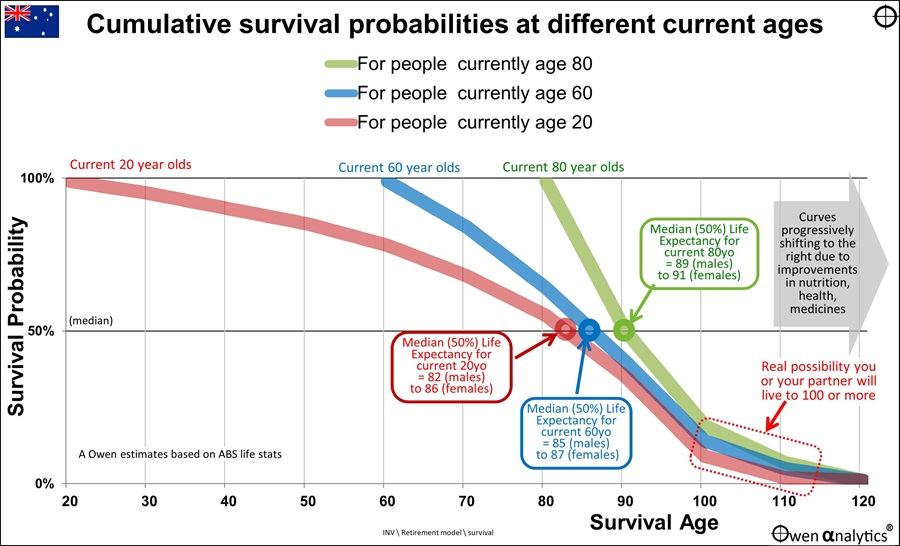
All three curves start out at the top at 100% because they are alive today, and there is a near-100% chance of surviving tomorrow. The curves decline over time – slowly at first – as people start to fall off the perch in untimely, early deaths.

All three curves decline over time, and they cross the 50% probability line (‘median’) at their current estimated median age of demise (death). These median ages are the same numbers from the first chart, except this second chart shows how today’s current 20-year-olds, 60-year-olds and 80-year-olds are likely to remain on the planet over time.

The three curves are deliberately depicted as broad lines to allow for the differences in life expectancy for males and females (and all of the various gender categories in between!)

For example, looking at the 60-year-olds (blue line) alive today, approximately 84% are likely to live to age 70, 64% are likely to live to age 80, 50% are likely to live to the median age of 85 (a mix of male/female/other).

Looking beyond the median age of demise (ie below the 50% line), 40% of today’s 60-year-olds are likely to live to age 90, around 14% are likely to live to age 100, and the rest are likely to live beyond 100.

The area in the red box in the lower right of the chart is to highlight the fact that in any couple, there is a real possibility that one of them will live to 100 and beyond.

Problem 3 – life expectancy has been steadily increasing throughout history, and this will probably continue

The life tables calculated by actuaries reflect current experience, current conditions, current technology and current medical knowledge. The problem is that human life expectancy has been rising steadily over time with improvements in medicines, hygiene, nutrition, health care, vaccines, technology, and many other factors.

There is every reason to believe that every decade that passes will further increase expected life spans, especially in ‘rich’ countries like Australia.

This means that the probability curves in both of today’s charts have been shifting steadily to the right (longer lifetimes) over time, and will probably keep shifting to the right in future. What you consider now as a remote possibility of living to 100, will become more and more likely over time.

Problem 4 – your own individual factors - health, fitness, lifestyle, diet, genetics, etc – may mean you live even longer

We can’t change our genetics, but we can try to remain as fit and healthy as possible for as long as possible. That is fine, but it will increase your chances of running out of money if you just use the standard calculators and life tables in planning for how much capital you need, and how much you can afford to spend.

If you consider yourself fitter and healthier than average for your age group, then it would be prudent to err further on the side of caution and plan to be on the high side of the ‘median’.

100 is not a bad age, and a nice round number to lock into your numbers to enhance confidence and peace of mind.

My parents

My father died a decade ago at age 80. He was born on a rubber plantation in Malaya (now Malaysia) and grew up on the bombed-out streets of war-torn, Japanese-occupied Singapore. He spent the next 30 years smoking five packets of cigarettes per day, and then a pipe at night (as a kid I remember stacking his pipe for the nightly puff). He ended up having a bunch of cancers (lung, prostate, bone, bone marrow), and had an excruciatingly painful last few years due to a twisted arthritic spinal cord. Was mentally very sharp to the end, but physically wrecked.

At birth, his life expectancy was probably around 50 at best (poor, rural third world country), so he ended up outliving that by probably three decades.

My mother is still battling on at 96. Mentally shot, but physically very durable. She's had numerous broken bones from countless falls (she literally got out of hospital last month after an operation on a broken femur – again), has had cancers removed (thyroid, bowel). In hospital about every month or so for a variety of things and has major operations once or twice per year. She has advanced vascular dementia from multiple minor strokes.

At her birth in 1928 in outback Australia, her life expectancy was 63 (Australian Year Book 1926, p.971), so she has also out-lived that by three decades so far, and she’s still going.

In both cases, their ‘survival curves’ shifted three decades to the right over their lifetimes. Mine and yours will probably do the same.

Me

In my own case, I was also born in a poor third world Southeast Asian country in the midst of colonial battles for independence and communist uprisings, so my life expectancy at birth would have been perhaps 50 or 60 at best.

Had I been born in Australia (where I have been lucky enough to have lived most of my life), my life expectancy at birth would have been 67 (Australian Year Book 1959, p.346). But having survived thus far, my life expectancy is now 85 (ABS 3302 Table 1), so my survival probability curve (even if I had been born in Australia) has already shifted two decades to the right, and I’m not done yet.

Homework!

What was your life expectancy at birth? (If you were born in Australia, life expectancy tables are included in most Year Books. You can download Australian Year Books going back to 1901 here: www.abs.gov.au/)

Having survived thus far, what is your life expectancy now? See ABS 3302 - https://www.abs.gov.au/statistics/people/population/life-expectancy/latest-release

How far has your own survival probability curve shifted to the right over your lifetime so far? Be prepared for the real possibility of a much longer life than you might have thought.

Where are you and your family on the Survival Probability Curve?

You can plot yourself and your family on the Survival Probably Curve to get a rough picture of the future paths you are on.

Here is the second chart again – this time showing the positions of me and my family (including my father and younger brother who have passed away. Father’s circumstances outlined above. Brother died in a plane crash at age 52 – flying his own single-engine plane).
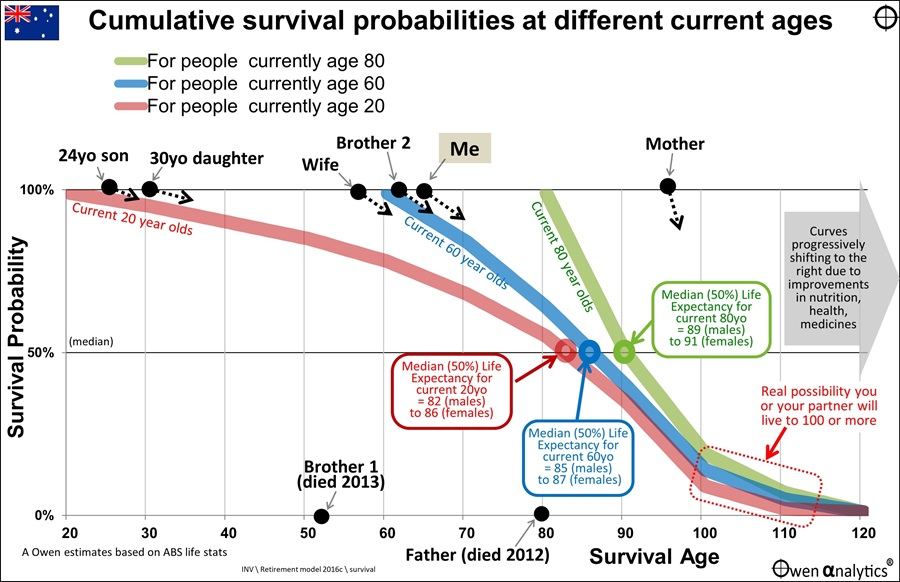
The arrows are all heading down, reflecting the ever-present risk of demise every day. But the good news is that every year you survive, you remain at the top 100% line, and shift one year to the right!

Where are you and your family on the Survival Probability Curve? Do you have better or worse genetics, fitness, health than other people your age?

What are the prospects of you living to 100 or beyond? How will you finance it?


Ashley Owen, CFA is Founder and Principal of OwenAnalytics. Ashley is a well-known Australian market commentator with over 40 years’ experience. This article is for general information purposes only and does not consider the circumstances of any individual. You can subscribe to OwenAnalytics Newsletter here. Original article is here: How to not run out of money in retirement - 4 big problems with life expectancy tables


11 Comments
PeterB
June 17, 2024

The reality of how statistics works is one member of a couple will have higher expected age at death than a single person alone. That is because in the situation of a couple the surviving member has a virtual 'second chance' of extending the longevity limit. A line on the survival probability chart for the age at death for the longest living member of a couple would be to the right of the lines shown in the article. Add to this statistical advantage, medical evidence is that people in a loving, caring and sharing relationship live longer than persons living alone.
I have read that the perfect plan is the cheque that you write on the day you die is bounced by the bank. That is impossible to plan as a recent retire, but as we age and eventually begin to feel 'old' there are hopefully opportunities to review the plan and share any over saved wealth with family, friends and worthy causes.

John De Ravin
June 16, 2024

Yes, I agree with others, great article Ashley.
Maybe two small points are worth mentioning. Firstly, while it is true that the Australian Life Tables calculate life expectancy using current mortality rates rather than projected rates, resulting in an understatement of actual average remaining life expectancy, sometimes the accompanying report does discuss exactly this issue. Peter Martin did, see here:

https://aga.gov.au/sites/aga.gov.au/files/publications/life_table_2010-12/downloads/Australian_Life_Tables_2010-12_Final_V2.pdf

His comments are at least mildly helpful in getting a handle on the potential impact of mortality improvements, though there are still multiple scenarios for future outcomes.

The other thing is that there are some online calculators that help you to form a view about your own personal life expectancy AFTER taking into account your own personal circumstances. David Williams’ website https://mylongevity.com.au/ is an example and there may be others.
But having said that, I also agree with the comments by Geoff Warren: life expectancy is only a part of the issue. Other parts include: bequest motive; risk aversion; asset allocation; willingness to tap into home equity; figuring out a drawdown approach; consideration of annuity purchase or other longevity protection (as Jim Hennington points out); and interaction between the retiree’s assets and the Australian age pension means testing process.

Geoff Warren
June 14, 2024

Thanks Ashley for the excellent article.. I have no problems with the analysis, and the story “you might live longer than you think” is worth getting out there. Although beyond the scope of this article, I have an issue with stopping there as it often is taken to imply the need to save more and spend less to guard against longevity “risk”. There is a much broader context here: 1. Whether to self-insure (ie hold back your spending just in case) or buy insurance (ie some form of annuity) 2. There are trade-offs involved. Save more = less to spend during the income years. Spending less in retirement runs the risk of not enjoying your assets when you are able ( active, and alive). Regret risk beckons. 3. The Age Pension and other government support (notably health) are pretty substantial forms of insurance for many Australians. If you are able to live on the AP if really necessary, why be too worried? 4. The research shows spending needs decline later in life. This should be taken into account. Just trying to place this article in a wider frame …

Jim Hennington, Actuary
June 15, 2024

Assuming you have to save more (spend less) to guard against longevity is only a valid concern if you're refusing to look at insurance to solve longevity risk. I.e. if you limit your options to account-based super and savings.

There are now three insurers and three super funds that offer investment-linked longevity insurance - as encouraged and incentivised by Treasury. These products can be priced based on averages because the insurer pools all this longevity risk (albeit the average of people who use them tends to be healthier people).

Lots to think about though. Great article.

Dudley
June 15, 2024

"save more (spend less) to guard against longevity":

If always save more than spend, then longevity is not a risk.

Happiness:
Capital gain 5%, Return 4%, spend 3%, inflation 2%:
= ((1 + 5%) * (1 + 4%)) / ((1 + 3%) * (1 + 2%)) - 1
= 3.94%

Slow misery:
Spend 7%, inflation 3%:
= ((1 + 5%) * (1 + 4%)) / ((1 + 7%) * (1 + 3%)) - 1
= -0.91%
Penury [ FV = 0 ] in:
= NPER(((1 + 5%) * (1 + 4%)) / (1 + 3%) - 1, 7%, -1, 0)
= 33.62 y.

Jim Hennington, Actuary
June 15, 2024

Dudley, that math changes as you get older.
What would it look like for a 90 year old ? :-) They can safely spend a much higher % of their savings than a 60 yo can.

Dudley
June 15, 2024

"What would it look like for a 90 year old ?":

Let's say they are not seeking any more financial [mis-]adventures and stick to money in the bank but are willing to gamble on their life expectancy being 8 y rather than median 5 y:

= PMT((1 + 5%) / (1 + 3%) - 1, 8, -1, 0)
= 13.62% / y

Which is around the minimum yearly super withdrawal for age 95 y:
https://www.firstlinks.com.au/how-not-to-run-out-of-money-in-retirement
90 to 94, 11%
95+, 14%

Ashley Owen
June 14, 2024

Thanks Dave. I got through tha without mentioning the L word once. Too hard to spell!
ao

David Williams
June 13, 2024

Thanks Ashley for adding really usefully to recent insights reflecting the impact of longevity on our society and each of us personally.
Knowing is one thing, but what to do about it is another. Many readers are focused on financial solutions, but these are only as good as the weakest data – which is usually ‘how long am I planning for’.
This is why longevity planning has developed. It starts with ‘me’ and provides me with the opportunity to make informed decisions about how to approach my own longevity – identifying immediate and longer term steps. My partner and I each achieve a unique view of our own futures, including the actions intended. This enables us to review our differences and harmonise our approaches.
Longevity planning frames and informs health, financial and estate planning decisions to focus professional advice in those disciplines. It is available online and has no compliance issues. It supports people in more confidently making the best of their longevity – the rest of their life. It highlights the opportunities and realities of longevity in identifying and supporting action, not merely’ knowing’ about it. It is the future.

Kevin
June 13, 2024

Dear Asley
Thanks for the good news . I will be living to 116!!!!!!!!!!
I will have to be frugal with my super drawdowns.
Kevin

OldbutSane
June 13, 2024

Actually Kevin, it is not what you drawdown that matters, but how much of it you actually spend. Legislation dictates your minimum drawdowns, but not what you do with it. Too many people seem to be confused about this as super drawdowns are designed so that you withdraw all your money from super at about age 90 (if you want to keep your income fairly constant in real dollars). No one is telling you how much of it you must spend.


Leave a Comment:

RELATED ARTICLES

How long will you live?

Many people misunderstand what life expectancy means

7-point checklist for managing the uncertain timing of death

banner

Most viewed in recent weeks

Vale Graham Hand

It’s with heavy hearts that we announce Firstlinks’ co-founder and former Managing Editor, Graham Hand, has died aged 66. Graham was a legendary figure in the finance industry and here are three tributes to him.

Australian stocks will crush housing over the next decade, one year on

Last year, I wrote an article suggesting returns from ASX stocks would trample those from housing over the next decade. One year later, this is an update on how that forecast is going and what's changed since.

Avoiding wealth transfer pitfalls

Australia is in the early throes of an intergenerational wealth transfer worth an estimated $3.5 trillion. Here's a case study highlighting some of the challenges with transferring wealth between generations.

Taxpayers betrayed by Future Fund debacle

The Future Fund's original purpose was to meet the unfunded liabilities of Commonwealth defined benefit schemes. These liabilities have ballooned to an estimated $290 billion and taxpayers continue to be treated like fools.

Australia’s shameful super gap

ASFA provides a key guide for how much you will need to live on in retirement. Unfortunately it has many deficiencies, and the averages don't tell the full story of the growing gender superannuation gap.

Looking beyond banks for dividend income

The Big Four banks have had an extraordinary run and it’s left income investors with a conundrum: to stick with them even though they now offer relatively low dividend yields and limited growth prospects or to look elsewhere.

Latest Updates

Investment strategies

9 lessons from 2024

Key lessons include expensive stocks can always get more expensive, Bitcoin is our tulip mania, follow the smart money, the young are coming with pitchforks on housing, and the importance of staying invested.

Investment strategies

Time to announce the X-factor for 2024

What is the X-factor - the largely unexpected influence that wasn’t thought about when the year began but came from left field to have powerful effects on investment returns - for 2024? It's time to select the winner.

Shares

Australian shares struggle as 2020s reach halfway point

It’s halfway through the 2020s decade and time to get a scorecheck on the Australian stock market. The picture isn't pretty as Aussie shares are having a below-average decade so far, though history shows that all is not lost.

Shares

Is FOMO overruling investment basics?

Four years ago, we introduced our 'bubbles' chart to show how the market had become concentrated in one type of stock and one view of the future. This looks at what, if anything, has changed, and what it means for investors.

Shares

Is Medibank Private a bargain?

Regulatory tensions have weighed on Medibank's share price though it's unlikely that the government will step in and prop up private hospitals. This creates an opportunity to invest in Australia’s largest health insurer.

Shares

Negative correlations, positive allocations

A nascent theme today is that the inverse correlation between bonds and stocks has returned as inflation and economic growth moderate. This broadens the potential for risk-adjusted returns in multi-asset portfolios.

Retirement

The secret to a good retirement

An Australian anthropologist studying Japanese seniors has come to a counter-intuitive conclusion to what makes for a great retirement: she suggests the seeds may be found in how we approach our working years.

Sponsors

Alliances

© 2024 Morningstar, Inc. All rights reserved.

Disclaimer
The data, research and opinions provided here are for information purposes; are not an offer to buy or sell a security; and are not warranted to be correct, complete or accurate. Morningstar, its affiliates, and third-party content providers are not responsible for any investment decisions, damages or losses resulting from, or related to, the data and analyses or their use. To the extent any content is general advice, it has been prepared for clients of Morningstar Australasia Pty Ltd (ABN: 95 090 665 544, AFSL: 240892), without reference to your financial objectives, situation or needs. For more information refer to our Financial Services Guide. You should consider the advice in light of these matters and if applicable, the relevant Product Disclosure Statement before making any decision to invest. Past performance does not necessarily indicate a financial product’s future performance. To obtain advice tailored to your situation, contact a professional financial adviser. Articles are current as at date of publication.
This website contains information and opinions provided by third parties. Inclusion of this information does not necessarily represent Morningstar’s positions, strategies or opinions and should not be considered an endorsement by Morningstar.