Register For Our Mailing List

Register to receive our free weekly newsletter including editorials.

Home / 356

Retiree spending patterns differ from most expectations

The financial services industry may have underestimated the dramatic fall-off in retiree spending as retirees age, according to our analysis of real-world expenditure data. This is potentially a positive message for retirees and their advisers dealing with the Covid-19 crisis.

How retirement spending falls

The median retired couple’s expenditure falls by more than one-third (36.7%) as they move from their peak spending years in early retirement (65 to 69 years-of-age) and into older age (85 years and beyond). The decline in expenditure for couples is relatively stable in the early years of retirement at about 6% to 8% across each four-year age band, but then rapidly accelerates once retirees pass 80 years-of-age.

Association of Superannuation Funds of Australia (ASFA) has previously estimated a ‘comfortable’ couple aged 85+ years will spend about 8% less than those aged 65-85 years of age. Another industry study by the Australian Institute of Superannuation Trustees (AIST), based on Household, Income and Labour Dynamics in Australia (HILDA) data, has suggested that spending may not decline materially through retirement.

However, the Milliman Retirement Expectations and Spending Profiles (ESP) analysis is the first based on the actual spending of more than 300,000 Australian retirees.

The data shows that retirees’ food expenditure—the largest component of essential spending—declines steeply with age, while health spending increases with age but dips again after age 80. All discretionary expenditure, such as travel and leisure, declines throughout retirement.

The faster-than-expected drop-off in spending casts doubt on some common rules of thumb and suggests that financial plans for retirees that assume a steady or increasing spending over time may be conservative relative to actual behaviour. This is potentially good news for advisers and their clients given recent events.

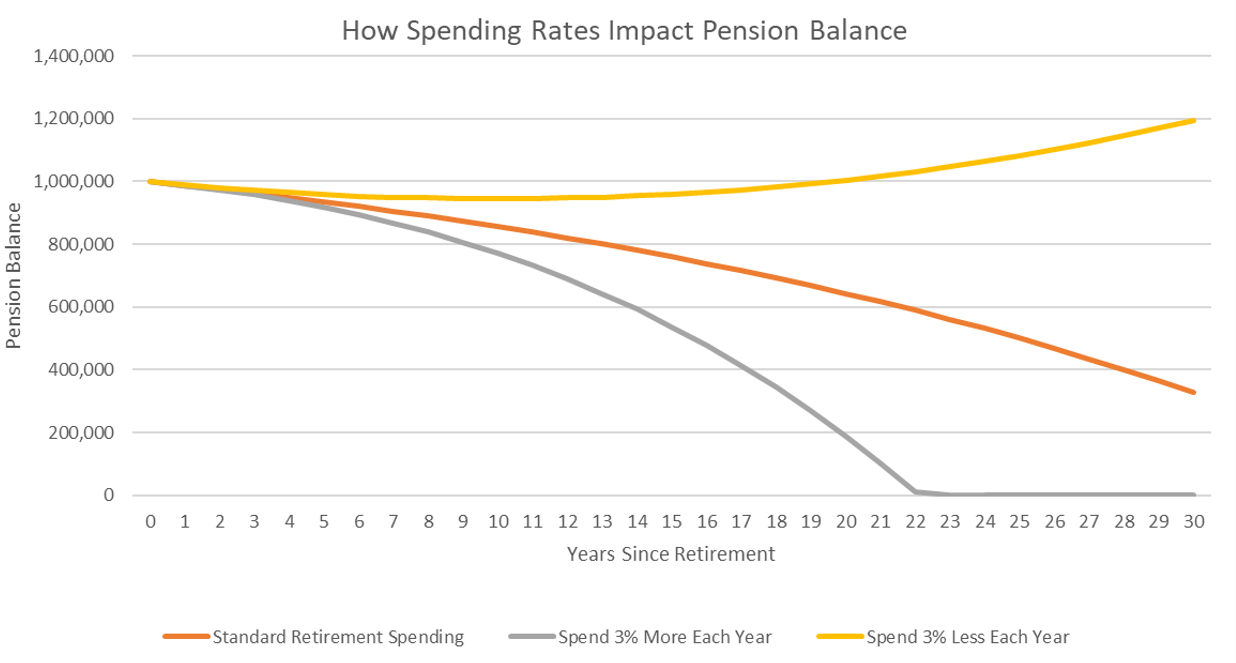
If we compare a small increase of 3% each year in a $50,000 p.a. retirement spend with an equivalent decrease of 3%, we find that this change has massive implications on retirement account balances (Figure 1). In fact, in the scenario where spending decreases annually, retirees can end up with a higher account balance than when they first retired, due to underlying asset growth outstripping spending.

Even assuming no annual increase in spending results in a drastically different picture that can help to offset the concern of seeing a drop in asset values as a result of market volatility.

Figure 1: How spending rates impact pension balance

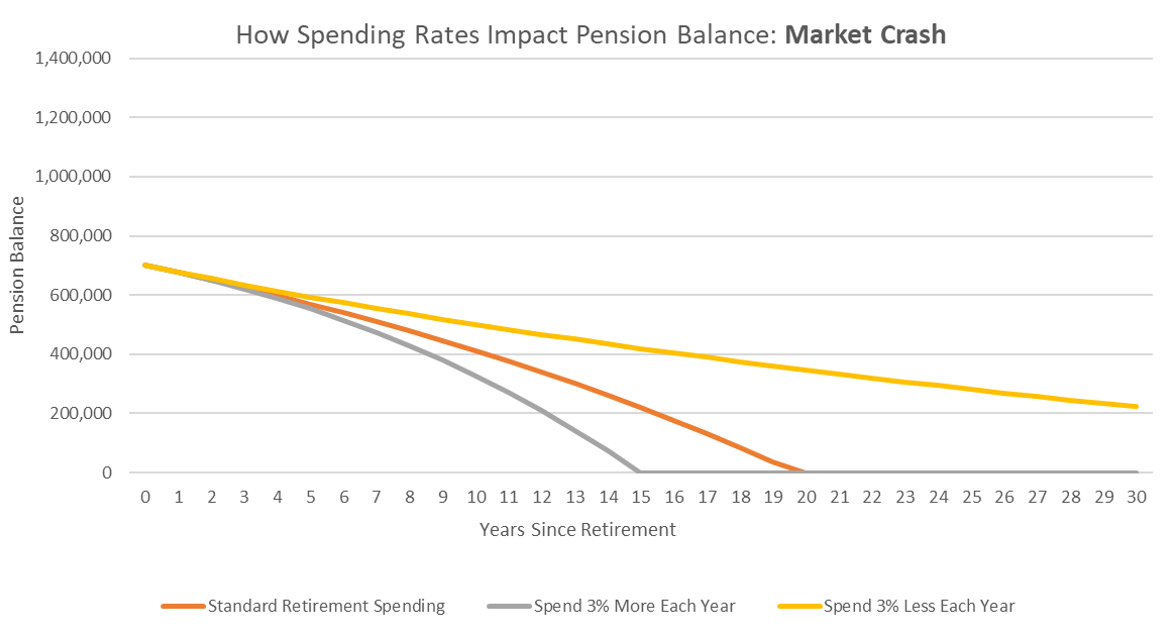
Additionally, this drop off in spending can help soften the impact of a market crash shortly before retirement (Figure 2). If we consider a 30% drop in asset values, but still take the same annual withdrawal amounts as before, decreasing spending throughout retirement mitigates longevity risk and helps reduce the chances of funds running out.

Figure 2: How spending rates impact pension balance in a market crash scenario

Experience navigating retirement

Financial advisers are well positioned to coach clients that may have recently entered or are considering retirement. Their experiences with other clients who have successfully navigated retirement for many years are real-life examples of the lifestyle changes and reduced spending behaviour that evolves naturally.

In addition, clients of financial advisers will be better placed to amend their short-term behaviour and, combined with changes to minimum withdrawal rates, will be more resilient in the face of ongoing volatility. This may mean dialling back areas of discretionary expenditure in order to focus on the essential costs of daily living.

Incorporation of conservatism within the planning process, whether captured in client goals, the use of bucket strategies or implementation of portfolio risk management approaches can be a boon in times such as these.

Key assumptions and methodology

A 30-year timeline has been used, with an initial withdrawal of $50,000 p.a. A flat withdrawal amount is compared with an amount increasing by 3% annually and one decreasing by 3% annually.

A starting account balance of $1,000,000 has been assumed along with a rate of 4% growth p.a. on this balance, post withdrawal each period.

In the market crash scenario, the starting account balance was decreased to $700,000 to simulate an instantaneous 30% drop in asset values.


Wade Matterson is a Principal, Senior Consultant, and leader of Milliman’s Australian Financial Risk Management practice and a fellow of the Institute of Actuaries of Australia. This article is general advice only as it does not take into account the objectives, financial situation or needs of any particular person.


8 Comments
DougC
May 09, 2020

Wade, an interesting article (and comments).
I have not quite reached the age of 80 but I am finding that my spending is reducing each year. I travel overseas usually once a year to visit distant family and friends but not now for “tourism” reasons having visited most places that I always wanted to see. I drive less, to the extent that my 12 year old car is still in good repair and lowish mileage and doesn’t need replacing. My health remains good. Almost half my spending goes on helping my 2 sons. We own our own house; I have more clothes in my wardrobe than I can wearout in the rest of my life; and we only infrequently eat out. Our absorbing interests and hobbies are quite inexpensive.
However, I have friends and acquaintances whose spending habits are quite different, especially in terms of travel, wining & dining; replacing cars regularly and state of health, and the spread of average spend between us is very wide. So declining spending with increasing age is a matter of lifestyle (discretionary) and circumstances (non-discretionary) for which a chart showing data-spread rather than data-average would be interesting to see.

Wade Matterson
May 07, 2020

Thanks everyone for your comments and questions.

As some have pointed out, there are some simplifying assumptions within this particular article. In part this was done deliberately given the intent was to highlight the impact simply changing the trajectory of retirement spending (declining, flat or rising) can have on asset values and as a result the conversations advisers may have with their clients. The analytical tools we have developed take into consideration the wide range of factors that will impact overall balances, including minimum draw down rules, means tested age pension payments (the subject of another recent piece of research we have conducted) as well as other relevant items.

There is a wide range of research we have conducted particularly on retirement spending over a number of years which goes into much more detail than was possible to incorporate in this article (apologies both Johns), however, what is clear from this work is that many of the anecdotal assumptions or views we had prior to this work have been challenged and tested. Ultimately this has resulted in additional questions and analysis, hopefully resulting in a deeper understanding of retiree behaviour.

I would be happy to discuss this work further or point you in the direction of some of the supplemental research if interested.

Michael2
May 09, 2020

It is so hard to predict what our circumstances will be as we age, but I have noted my mother and her partners spending has dropped off markedly as they move to mid to late eighties in years, but they weren't big spenders anyway.

RobG
May 06, 2020

Scant mention of Govt mandated drawdown rates for pension accounts - if you are 70, your account balance must be drawn down by minimum 5% - up to 11% if you make 90. Each year your account goes down by the mandated minimum and up by the earnings. What you "spend" is irrelevant to the balance, unless you are spending and withdrawing, more than the minimum. The above graphs take no account of that reality.

For individuals it is more complex - if the mandated minimum exceeds their cost of living, it still comes "out" of the Pension Fund - it can be invested elsewhere at marginal tax rates, spent, given away, whatever, but the Pension balance is still reduced. The clear Govt intent is that you are forced to reduce your Pension Account as you age - when you finally cark it, we have a death tax "in drag", on the Taxed Component of what's left!

Simplistic analysis does not help, personal planning that brings all the factors together, does.

Sally
May 06, 2020

Absolutely agree with Rob's comments.
Given the massive decrease in my portfolio valuation (and debatable as to whether this will fall further or go up), the impact of reduced or suspended dividends, and the fact that I believe that the Government will stop franking credits in the not so distant future (as well as include the family home in the assets test for everything ... including SAPTO ) it is unlikely that income will be greater than the mandated minimum draw downs .... even at the current 50% reduced rate.
What a terrible time to have retired!

Bob T
May 10, 2020

Yes. Relevance of drawdown depends on what you do with it. If you simply switch funds from super to personal account, the difference is only the tax savings (which could be little if in low tax bracket). If you spend it, of course, the effect is larger. The point is that drawdown itself is not determinative factor.

John De Ravin
May 06, 2020

Wade this is very interesting and very important. As you say, it has significant financial planning implications, for advisers and their clients. (And the advice firms, which could consider building different expenditure assumptions into their standard software!).

I have a couple of questions though.

1 It's not clear from the article whether the various references to spending changes are real or nominal (eg the assertion that spending decreases by 6% to 8% as you move to the next older quinquennial age band. Does that mean that expenditure declines by 6% to 8% in nominal dollars or real (inflation adjusted) dollars?

2 I was wondering why the rate of health expenditure would decline "rapidly" after age 80. Anecdotally there are a lot of health costs in the last year or two of life, which would suggest high health expenditure at the older ages. Is that because a lot of those costs are not borne by the elderly individual, but by the public medical and hospital systems?

3 The methodology of the study is not clear from the article. Is it possible that some of the findings are influenced by the wealth of the relevant cohort of retirees? For example, that older retirees are found to spend less - but is that because older retirees had fewer years of Superannuation Guarantee, so they HAVE LESS to spend?

4 Is a full version of the Milliman research paper available?

Again thanks for a very interesting article.

John Wilson
May 06, 2020

John,
I totally agree with your points.
There is a further possible wrinkle in that, if the older retirees have less to spend, they may choose to not pay for medical care or for medical insurance. This would lead to them relying more on the public system, providing a feedback loop into your second point. The rapid decline of health expenditure after age 80 looks wrong.


Leave a Comment:

RELATED ARTICLES

How the age pension helps retirees cope with losses

Time to smash the retirement nest egg - but how?

Four reasons many Australians will work until they're dead

banner

Most viewed in recent weeks

Are term deposits attractive right now?

If you’re like me, you may have put money into term deposits over the past year and it’s time to decide whether to roll them over or look elsewhere. Here are the pros and cons of cash versus other assets right now.

Uncomfortable truths: The real cost of living in retirement

How useful are the retirement savings and spending targets put out by various groups such as ASFA? Not very, and it's reducing the ability of ordinary retirees to fully understand their retirement income options.

Is Australia ready for its population growth over the next decade?

Australia will have 3.7 million more people in a decade's time, though the growth won't be evenly distributed. Over 85s will see the fastest growth, while the number of younger people will barely rise. 

How retiree spending plummets as we age

There's been little debate on how spending changes as people progress through retirement. Yet, it's a critical issue as it can have a significant impact on the level of savings required at the point of retirement.

20 US stocks to buy and hold forever

Recently, I compiled a list of ASX stocks that you could buy and hold forever. Here’s a follow-up list of US stocks that you could own indefinitely, including well-known names like Microsoft, as well as lesser-known gems.

Where Baby Boomer wealth will end up

By 2028, all Baby Boomers will be eligible for retirement and the Baby Boomer bubble will have all but deflated. Where will this generation's money end up, and what are the implications for the wealth management industry?

Latest Updates

Property

Financial pathways to buying a home require planning

In the six months of my battle with brain cancer, one part of financial markets has fascinated me, and it’s probably not what you think. What's led the pages of my reading is real estate, especially residential.

Meg on SMSFs: $3 million super tax coming whether we’re ready or not

A Senate Committee reported back last week with a majority recommendation to pass the $3 million super tax unaltered. It seems that the tax is coming, and this is what those affected should be doing now to prepare for it.

Economy

Household spending falls as higher costs bite

Shoppers are cutting back spending at supermarkets, gyms, and bakeries to cope with soaring insurance and education costs as household spending continues to slump. Renters especially are feeling the pinch.

Shares

Who gets the gold stars this bank reporting season?

The recent bank reporting season saw all the major banks report solid results, large share buybacks, and very low bad debts. Here's a look at the main themes from the results, and the winners and losers.

Shares

Small caps v large caps: Don’t be penny wise but pound foolish

What is the catalyst for smalls caps to start outperforming their larger counterparts? Cheap relative valuation is bullish though it isn't a catalyst, so what else could drive a long-awaited turnaround?

Financial planning

Estate planning made simple, Part II

'Putting your affairs in order' is a term that is commonly used when people are approaching the end of their life. It is not as easy as it sounds, though it should not overwhelming, or consume all of your spare time.

Financial planning

Where Baby Boomer wealth will end up

By 2028, all Baby Boomers will be eligible for retirement and the Baby Boomer bubble will have all but deflated. Where will this generation's money end up, and what are the implications for the wealth management industry?

Sponsors

Alliances

© 2024 Morningstar, Inc. All rights reserved.

Disclaimer
The data, research and opinions provided here are for information purposes; are not an offer to buy or sell a security; and are not warranted to be correct, complete or accurate. Morningstar, its affiliates, and third-party content providers are not responsible for any investment decisions, damages or losses resulting from, or related to, the data and analyses or their use. To the extent any content is general advice, it has been prepared for clients of Morningstar Australasia Pty Ltd (ABN: 95 090 665 544, AFSL: 240892), without reference to your financial objectives, situation or needs. For more information refer to our Financial Services Guide. You should consider the advice in light of these matters and if applicable, the relevant Product Disclosure Statement before making any decision to invest. Past performance does not necessarily indicate a financial product’s future performance. To obtain advice tailored to your situation, contact a professional financial adviser. Articles are current as at date of publication.
This website contains information and opinions provided by third parties. Inclusion of this information does not necessarily represent Morningstar’s positions, strategies or opinions and should not be considered an endorsement by Morningstar.