In 2008, a combination of Rio Tinto management mistakes and the GFC saw the RIO share price fall from a May 2008 high of $124 to $41. The Chinese sensed an opportunity and lobbed a cheeky bid for some of the assets and a 18% stake at a premium to the market's valuation. Apparently, the Chairman of RIO finally said:
“There’s only one Pilbara, it only gets sold once and it never gets sold cheap.”
The Pilbara and RIO’s mines were easily the lowest cost in the world, closest to the end-user market and an honest government. They were the premier resource assets in the world and irreplaceable. The RIO price has increased fourfold since then.
In the same way, the major Australian banks (along with the big 5-6 Canadian banks) are the Pilbaras of the global financial system. Rock solid. The banks have high returns, low volatility and enormous moats which have been, and will remain, structurally impenetrable.
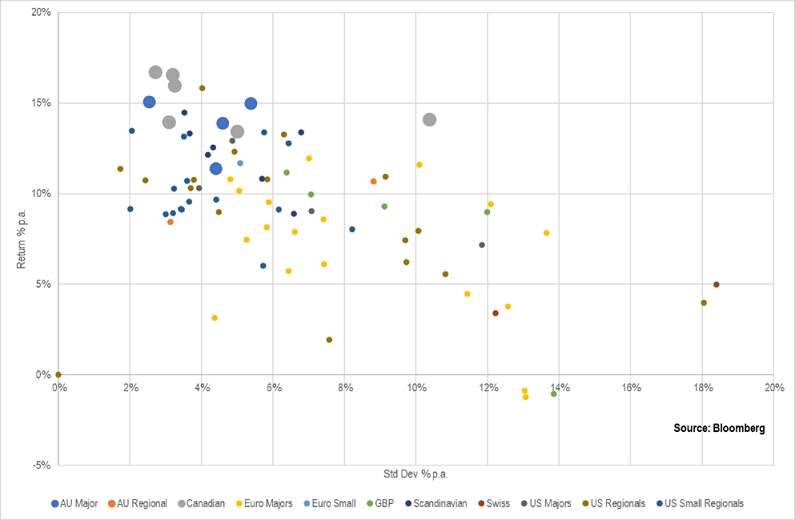
This first chart shows average Returns on Equity (RoE) since 2000 (vertical axis) and the volatility of those returns (horizontal axis) for 90 banks on both sides of the Atlantic (and Australia). We’ve split them by domicile and highlighted the Australian (large blue dots) and Canadian banks (large grey dots). It’s apparent which banking groups to invest in.

Banking 101 and bank strength
Successful banks do three things: be in a position to borrow enough money, at the right price, and lend to customers at the right price. Muck one of the three up and you don’t make enough profit. The big four Australian banks can make supernormal profits because they control deposits in a manner which is largely unparalleled.
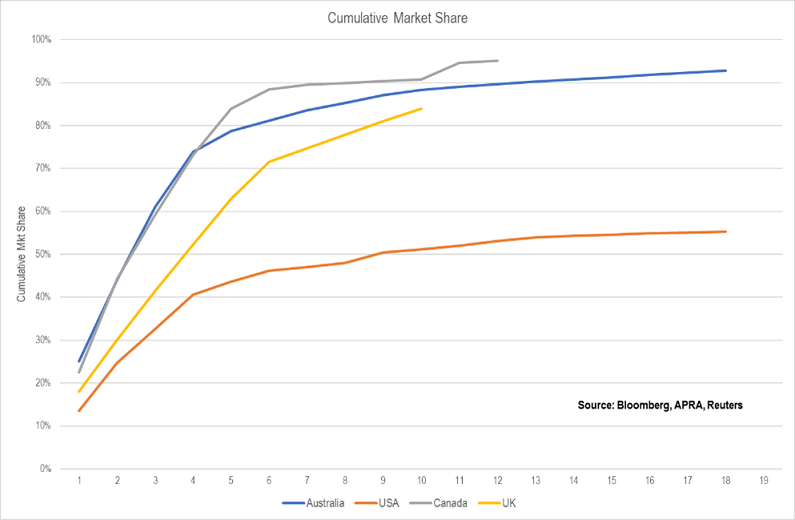
In 2002, the big four gathered 66% of all deposits with the fifth-largest (St George) having an 8% market share. In 2023. it’s 78% with Macquarie the next largest at 5%. Is that 20 years of progress? More like 20 years of banks using the occasional crisis to strengthen monopoly positions and a lazy or ineffective competition regulator.
The next chart shows the deposit dominance of Australian and Canadian banks compared with the US and UK banks (note UK data is market share of mortgage lending, not deposits, so not exactly the same thing). The cumulative market share (vertical axis) is shown by the number of banks (horizontal axis). So, In Australia and Canada, we pretty much all dump our money in the top four banks. No other bank can get a foothold.

Deposit control leads to margin pricing power
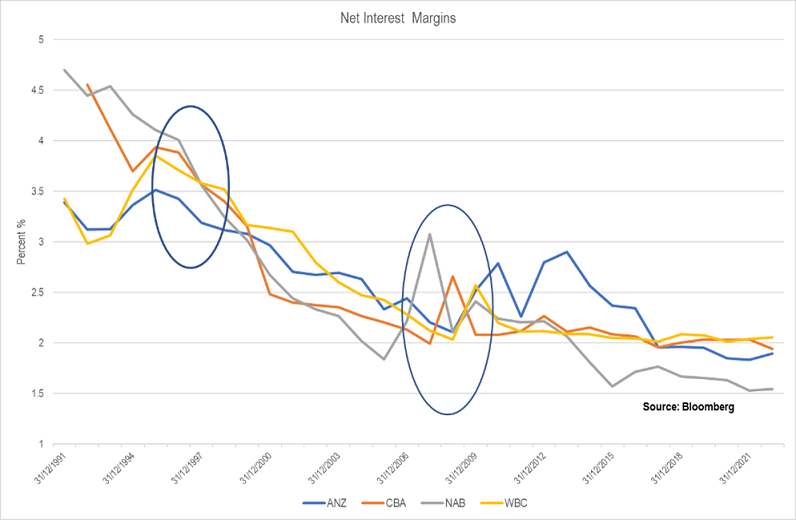
The link between controlling the deposit market and monopoly profits is net interest income and the key short-term driver of that is the Net Interest Margin (NIM). The chart shows NIMs of the major banks since the early 1990s. NIMs have been in a structural decline since the 1970s, but there are two significant periods when NIMs were increased, which are circled. The first was in the early 1990s when all but NAB and to a lesser extent CBA (both lost less money on commercial property in that period than the other two banks) put their margins up. Post GFC losses, they all increased margins.

So, banks will gently compete against each other, and margins slowly fall. If there are general, or bank specific, speedbumps, banks put their margins up for a few years to play profit catch up. It’s not long enough for smaller banks to gain market share, so we’re then back to the status quo of the ‘four-opoly’ earning supernormal profits. Once profit is restored, banks resume normal business of lots of smoke and not much bang about competition to see if they can gain a few more percent of market share without hurting profits too much.
What does this mean for hybrids?
The big risk for hybrids is that APRA declares non-viability and hybrids get converted to equity. For the past decade since ‘non-viability’ was introduced, we’ve never seen anything but super-viability.
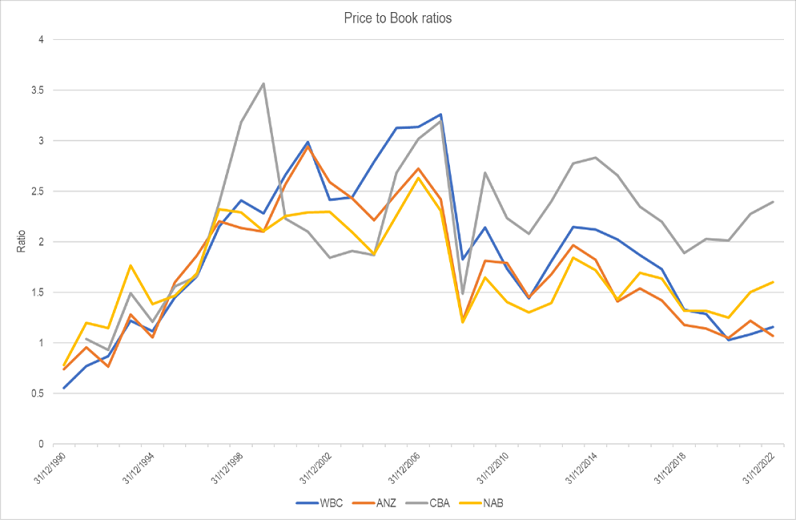
If the probability of non-viability increases from the current near-zero to a higher number, we would expect hybrid prices to decrease. Both are not good outcomes. However, we think the excess profitability makes non-viability risk extremely remote. Price-to-Book (P/B) is a good metric for what the market thinks of the prospects of banks. If it is well below one, markets are assuming ongoing low profitability, hidden bad losses, problems with deposit funding or big upcoming equity issues. All these factors would indicate warnings about non-viability. The chart shows the P/B ratios for the big four since the 1990s and it’s a pretty picture for hybrid owners.

In the early 1990s which was probably the worst general banking crisis since the 1930s (maybe the 1970s?), system average P/B fell to 0.8 for a year (with WBC at around 0.6). Since then, system P/B fell to 1.2 during the GFC and Covid. No major bank has had a P/B below one since the 1990s.
As a contrast, the P/B of Credit Suisse was below 0.5 for the last three years and many of the big European banks have been below 0.6 for most of the last decade. The previous last big Euro bank resolution was the Banco Popular Espanol, which had a P/B of less than 0.1 for 2-3 years. That’s what non-viability looks like.
Can the big four become non-viable? Not from assets
We can’t see how the big banks can become non-viable from developments on the asset side. There is a massive virtuous circle of guaranteed profitability which means they can raise equity capital at a reasonable price, in addition to the natural accrual via profits.
In contrast, Euro banks haven’t been able issue capital because their P/B ratios are so low that equity raising is prohibitively dilutionary. They have had to zombie themselves to life by slowly reducing the balance sheet and retaining what profits they made, thus raising equity levels.
Deposit non-viability
As we have seen with Silicon Valley Bank and Credit Suisse, a deposit run kills banks quickly. This is where a disaster becomes intriguing. What if Australian depositors started a run on one bank? Where do they put their money? In one of the other big four? Given they all do pretty much the same thing they should all be suffering the same stresses, so that’s not a solution.
We think that a severe enough systemic problem would see the government guaranteeing all deposits. Is that a non-viability event and what does APRA do? Do they convert hybrids and Tier 2 and write equity off and let the government own the entire banking system? That doesn’t look like a good idea, but anything less than that should leave equity relatively unaffected and hybrids untouched.
Are remote risks already priced in?
Clearly there are fat tail risks for hybrids in times of severe banking stress, but we think they are priced in. Trading margins of 2.5% - 3% imply a situation where hybrids suffer 50% loss every 25 years. We think that is grossly pessimistic given the industry structure. In a practical sense, hybrid prices will fall well before we start getting into the theoretical universe of non-viability.
Campbell Dawson is Managing Director of Elstree Investment Management, a boutique fixed income fund manager. This article is general information and does not consider the circumstances of any individual investor. Financial advice should be sought before acting on any opinion in this article. Elstree's listed hybrid fund trades under ticker EHF1.