Conventional wisdom suggests that as you approach retirement you should move your savings into conservative, income-producing investments rather than leaving them in growth assets. Indeed there is merit in constantly reviewing your mix of assets but the average life expectancy of a male retiring at age 65 is around 18.5 years and a female 21.5 years. In fact, around 1 in 4 men retiring at age 65 will live at least another 25 years (to age 90), while 1 in 3 women will live past that milestone.
Many retirees’ greatest financial risk will be outliving their savings and having to rely on an unpredictable public pension. This paper illustrates that if they can live with the added volatility, retirees may be better off maintaining a significant allocation to growth assets, in particular shares, rather than switching wholly to more conservative asset classes such as cash, bonds or annuities.
Long term performance of equities and fixed income
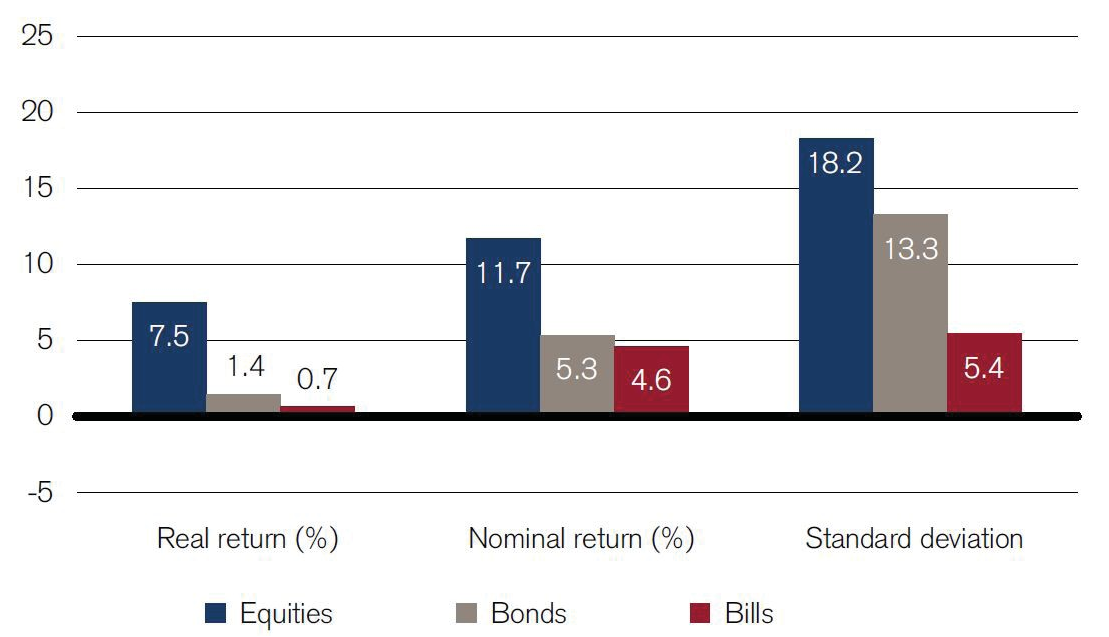
Shares are well known to offer the potential for higher returns than more stable asset classes, offset by the likelihood of higher volatility. This has been the historical experience. Chart 1 shows that the average nominal equity return over 110 years was 11.7% compared with bonds 5.3% and bills 4.6%.
Chart 1: Long term performance of different Australian asset classes 1900-2010
Source: Elroy Dimson, Paul Marsh and Mike Staunton, Credit Suisse Global Investment Returns Sourcebook 2010.
Past performance is not a reliable indicator of future performance.
Shares as an inflation hedge
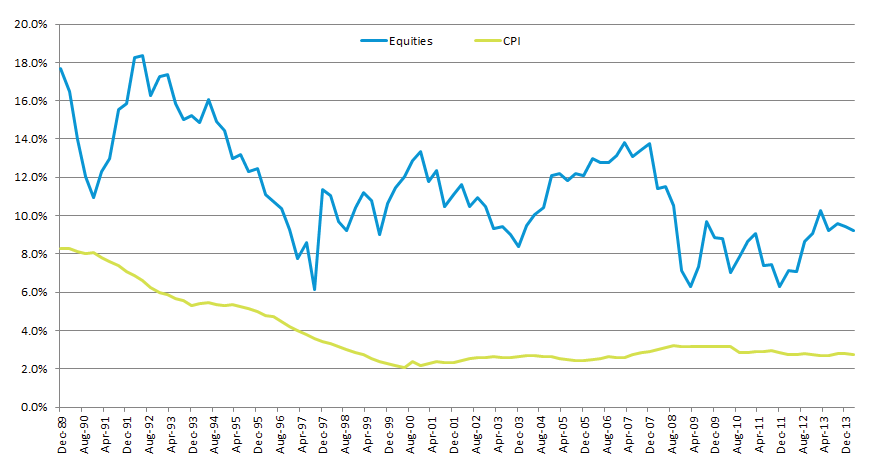
Australian shares have been one of the better inflation hedges over long periods of time. Chart 2 shows the rolling performance of Australian shares measured over 10 year periods. Over all rolling 10 year periods since 1980, shares have delivered positive returns and have outperformed inflation.
Chart 2: Rolling 10 year performance of Australian shares versus in?ation (CPI)
Source: Iress (XAOAI, ACPI).
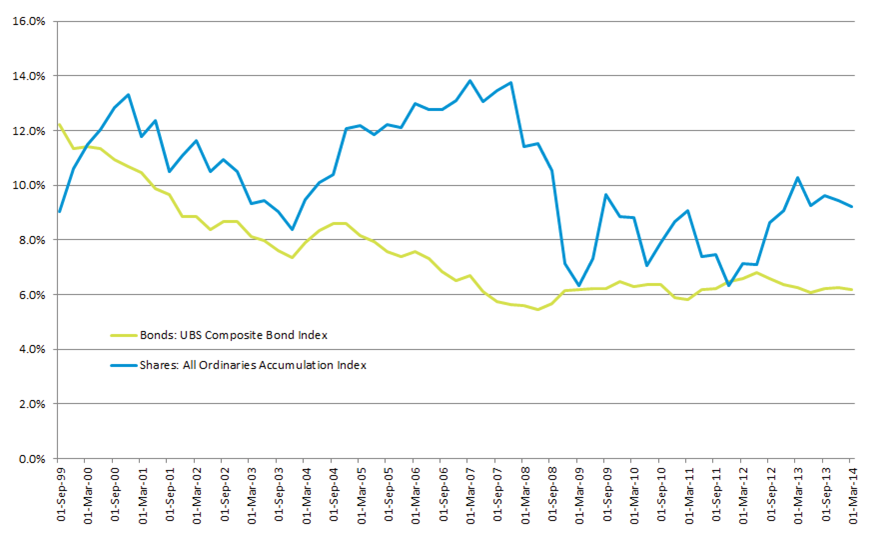
The back data for the bond market indices is more limited, but Chart 3 shows 10 year rolling performance of Australian shares relative to Australian bonds (Australian Composite Index). Over most periods, shares have been superior. We note however that bonds are likely to have done better than shares for a period prior to the commencement of this chart due to the compression in bond yields that took place in the late 1980s, combined with the poor performance of shares due to the crash of 1987. But over the 101 years to 2001, shares have been a better in?ation hedge than bonds as real returns, on average, have been better for shares than bonds.
Chart 3: Rolling 10 year performance of Australian shares and Australian bonds
Source: Iress (XAOAI, SCPALL).
Can shares provide an adequate stream of income?
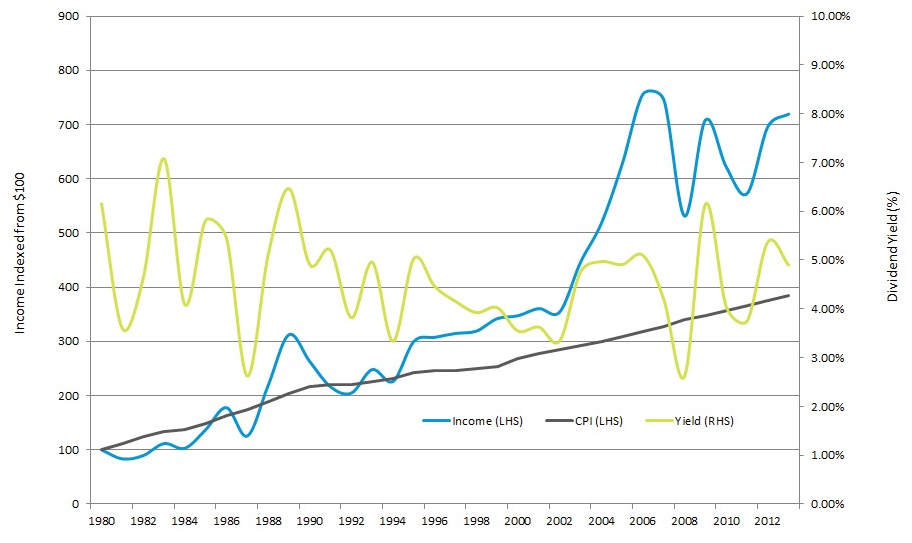
Dividends, while they have been volatile at times, have generally grown at a faster pace than living costs measured by CPI. Chart 4 excludes franking credits which are a cash benefit for Australian residents investing in Australian shares on top of income growth and capital return. When living off a combination of capital and income, an equity portfolio can serve investors well.
Chart 4: Dividend income, dividend yield and CPI (1980-2013)
Source: Iress (XAOAI, ACPI).
The Association of Superannuation Funds of Australia (ASFA) has suggested that a couple currently needs $57,665 per annum to retire with a comfortable lifestyle. We estimate that to avoid reliance on a pension for at least 25 years, a retiree will need a current starting balance of at least $1,043,794 (assumes 2.5% in?ation and 5% investment return per annum. No income tax is included). To consider whether an equity portfolio can support retirement, we have modelled equity funds for 25 year retirement periods starting in each years from 1965 to 1989 (1989 is 25 years ago) and for partial periods from 1990 to 2007 with full allocation to equities at the start.
In our analysis, we use the ASFA starting balance and retirement income stream noted above, instead of discounting both numbers back to the start of each retirement period. This effectively scales the starting capital and income requirements equally, such that the dollar values are more comparable between retirement years. In years where the dividend stream does not provide the required in?ation-adjusted income stream, shares are sold to meet that income objective. Essentially, if you didn’t run out of capital, you met your retirement income requirements. Our analysis shows that in many cases your estate would have ended up with far in excess of your starting capital, allowing you to leave a financial legacy for your family.
In Chart 5 below, we look at some of the retirement outcomes that generate both large positive and large negative capital outcomes. There are some outcomes where the initial capital is substantially eroded via draws on capital in order to maintain income levels. This chart includes some more recent experiences incorporating the GFC, but we have not allowed for potential income from aged pension entitlements. In each case, including the worst experience, initial equity investments would have sufficiently funded a retirement income for at least 25 years, and in many cases provided an additional capital legacy.
Chart 5: Capital remaining after living expenses
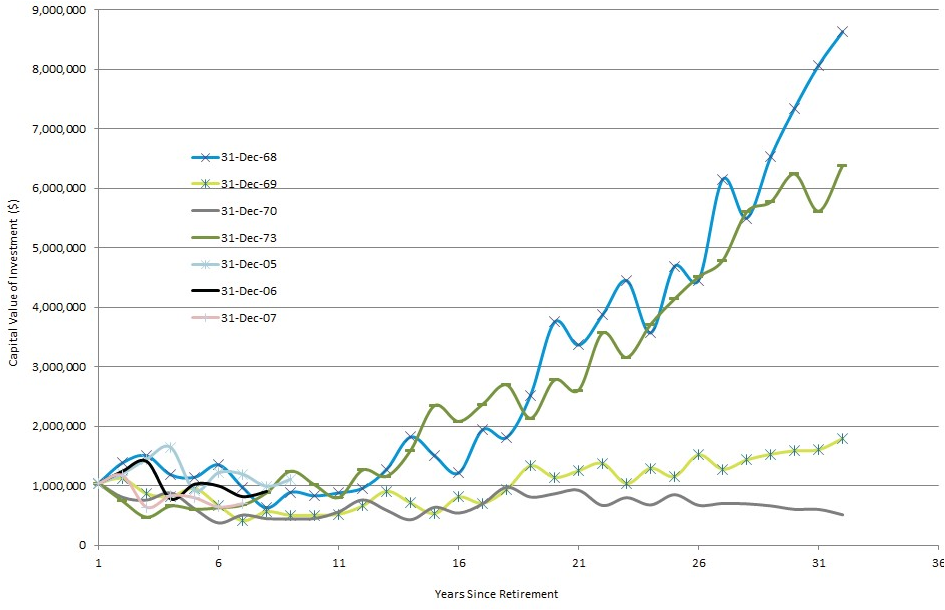
Source: Arnhem Investment Management. Past performance is not a reliable indicator of future performance.
Retirees might find this capital volatility too unsettling and are unlikely to take solace from the fact that holding all retirement funds in equities would have historically funded one’s retirement. Indeed, we have little doubt that those retiring in 1973 would not have had the resolve to maintain an equity portfolio, after seeing their retirement nest egg halve in just two years.
It should also be noted that this modelling assumes that spending power (in?ation) increases by 2.5% each year. Australia has however, experienced two periods of in?ation well in excess of this, in the early 1950s and the 1970s/early-1980s.
Would an equity portfolio have been able to maintain the real purchasing power while funding retirement through such extreme events? Based on historical equity market performance, the starting balance of $1,043,794 and starting income of $57,665 as used earlier can accommodate in?ation of up to 3.5% in all but one retirement year (1970). Lifting starting capital to $1,200,000 would see a retiree manage with in?ation of up to 5% in all years. However, they would have needed a far higher starting balance to maintain real purchasing power at the rates of in?ation experienced in the 1970s.
Conclusion
This analysis highlights the value of incorporating a significant equity weighting in an asset allocation during retirement years. We show that equities can deliver superior income outcomes and are a good hedge against in?ation. In addition, by choosing an equity portfolio which invests in companies that deliver growing dividends, financial circumstances may be better than if conservative ‘yield’ strategies are the sole focus. Returns from equities will be more volatile, and while they ought to form a meaningful part of post retirement income, they should also be balanced with lower volatility assets.
Mark Nathan is Managing Partner at Arnhem Investment Management.
This document is produced for general information only and does not constitute financial product advice, nor a recommendation to acquire any financial product. You should seek your own professional advice in relation to any financial product. The full research paper is linked here.