Fuelled by strong investor demand, the latest PCA/IPD Australian All Property Index reveals that non-residential property has performed strongly in recent years.
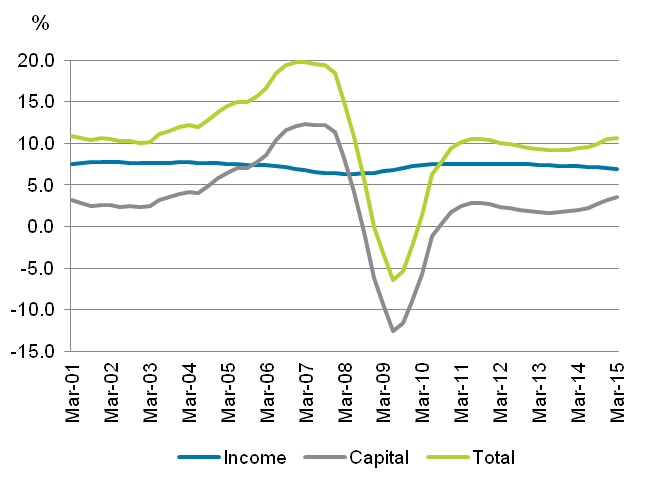
Direct non-residential property has been a key beneficiary of the hunt for yield, and for good reason. The lure of high and relatively stable income is driving investors to bid up property prices. Non-residential property generated an income return of 6.9% in the past year, underpinning the total return of 10.7%, as shown in Figure 1. This is now the sixth consecutive year of positive total returns since the GFC.
Figure 1: Non-residential Property Annual Returns to 31 March 2015

Source: PCA/IPD Australian All Property Index. The PCA/IPD Australian All Property Index tracks the performance of 1,293 non-residential property assets with a combined value of $137 billion. Participants represent A-REITs, unlisted wholesale and retail property funds, syndicates and private investors.
Property returns by sector
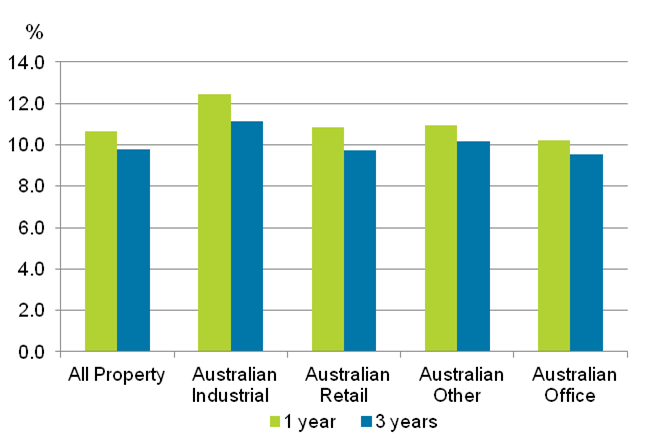
Industrial property was the standout performer over one and three years with a total return of 12.4% for the year and 11.2% p.a. for the 3 years to 31 March 2015 (Figure 2). The relative high yield (+8.2% in the past year) and the repositioning of the sector from manufacturing to high quality distribution centres leased to ‘blue-chip’ tenants driven by the growth in logistics (transport and storage) is attracting significant investment into industrial property. The industrial sector is also benefiting from rising land values as the rezoning of inner city industrial land to residential gathers momentum, particularly in Sydney and Melbourne.
Figure 2: Non-residential Sector Returns, One and Three Year to March 2015

Source: PCA/IPD Australian All Property Index
The next best-performing sectors were retail centres and other property (carparks, self-storage, medical centres, etc.), both with a total return of 10.9% for the year to March 2015. The robust retail sector performance was driven by solid capital growth - the 4.1% capital return was the highest of the major property sectors.
The recent cut in interest rates to their lowest level on record, lower fuel costs and a pick-up in housing activity have contributed to an improvement in retail sales however the rate of growth remains below the historical average. As evidenced by the recent sales updates from the listed retailers, parts of the retail environment still remain challenging due to both cyclical and structural factors (on-line retailing, changing retail formats etc.). Despite this, investors continue to chase retail centres, particularly sub-regional and neighbourhood centres; the major regional centres rarely change hands given they are tightly held by Westfield, AMP, Lend Lease and QIC.
Despite the office sector returning a healthy 10.2% for the year and 9.5% p.a. over three years, there is growing divergence in the performance of the major office markets. Melbourne CBD was the best-performing office market with a total return of 13.5%, 6.6% of which came from capital growth. Next best was the Sydney CBD office market with a total return of 11.5%. Both markets are benefiting from the strong competition from investors for office assets and signs that tenant demand is improving.
At the other end of the scale, the Perth CBD and Brisbane CBD markets are being impacted by the slowdown in the mining sector. Both markets recorded declines in value over the year of 1.9% and 0.3% respectively. We expect values in both these markets to fall further in the year ahead. Weak demand and further new supply will push the vacancy rate in both markets higher – above 15.0% in Brisbane and more than 20% in Perth – putting further downward pressure on rents and values.
Property versus other asset classes
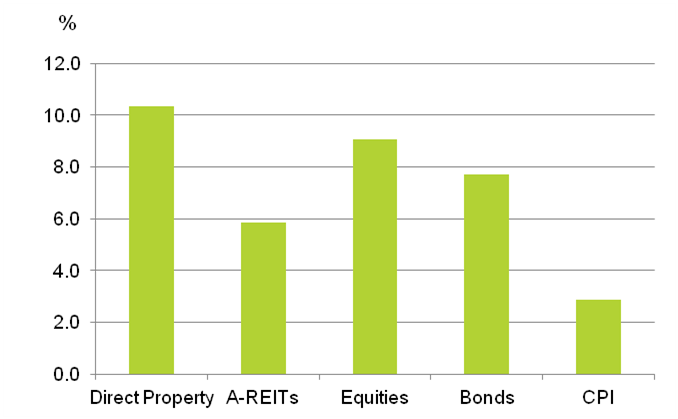
Whilst non-residential property was not immune from the GFC fallout (capital values fell 12.5% in 2009), its performance over the longer-term has been stellar, generating a total return of 10.4% p.a. over the past 15 years outperforming A-REITs (+5.9% p.a.), Australian equities (+9.1% p.a.), and bonds (+7.7% p.a.) (Figure 3). As a rule of thumb we expect non-residential property to generate a total return of 10% over a cycle with circa 7% coming from income and 3% from capital growth.
Figure 3: Non-residential Property versus Other Asset Classes, Annualised Total Return 15 Years to 31 March 2015

Source: PCA/IPD Australian All Property Index, MSCI Indices
As we approach the half way mark of 2015, we expect continued strong investor demand for non-residential property to support total returns above 10%. According to IPD, the spread between bond rates and non-residential yields is now 432 basis points, well above the long-term average 232 basis points. With 10 year bond yields not far off their historic lows, on this measure, non-residential property looks attractive.
For global investors, Australian non-residential property looks cheap relative to the 3-5% yields on offer in the gateway cities of London, New York, Tokyo and Hong Kong. A significant amount of equity has been raised to invest in property globally. One example that typifies this global phenomenon is the private equity juggernaut, Blackstone, who recently raised $US15 billion ($19.5 billion) from pension funds and endowment foundations, to invest in global real estate – some of which is earmarked for Australia. Add leverage to this, and they have a $30 billion ‘war chest’ to deploy.
We also have a huge wave of Asian capital, particularly from the Chinese and Singaporeans, looking for a home in Australian property. Debt market conditions are favourable, both availability and cost, and as one global investor told me on a recent trip to Hong Kong, “Australian property may look expensive to you but to us it is not – our cost of capital is lower than your domestic capital and this is not going to change anytime soon.”
Risks to watch for
Despite interest rates being at historical lows, investors should continue to assess how various interest rate scenarios may impact the performance of property going forward. Although we expect rates to stay lower for longer, investors need to keep an eye on the long-end of the yield curve, as it is the long term bond rate (not the cash rate) that property investors use as the yardstick for comparing property ‘cap’ rates. Any rise in long bonds over the next two years is likely to be modest or even delayed if the Australian economy weakens further. However, the recent sell-off in bonds in response to comments made by the US Federal Reserve Chair Janet Yellen, served as a timely reminder of continuing volatility in global capital markets and one thing is assured, Australian non-residential property will not be immune from any future impending fallout.
Whilst interest rates are an important consideration in the purchase of property, they are not the only consideration. Investors need to exercise caution that acquisitions make sense on a through-the-cycle basis and capital structures (debt levels and LVR covenants) remain relevant through the cycle.
Property is a total return proposition and the current focus on yield may not entirely compensate investors for loss of capital down the track if yields blow-out. With below trend economic growth forecast in the next few years, we expect tenant demand to slowly improve across most Australian non-residential property sectors and sub-markets. The cost of securing tenants will remain high with elevated incentive levels leading to lacklustre rental growth. When asset prices are being driven by unprecedented liquidity being injected into the financial system rather than underlying real estate market fundamentals, we find ourselves heading into uncharted territory. As a result, we are now in an environment where investors need to exercise caution.
It is imperative therefore, that investors identify and quantify the risk in their property portfolios. Factors such as the supply and demand dynamics of the market, strength of lease covenants, duration of the leases, and rent review mechanisms remain fundamental to the assessment of risk. Answers to these will be critical in the investment decision to either buy at this point in the cycle or sell assets in order to take advantage of investors who are becoming increasingly aggressive in their requirement to deploy capital.
If there is one thing that remains a priority for all investors it is having a well-diversified portfolio. Bought well, non-residential property has a key role to play in a mixed asset portfolio.
Adrian Harrington is Head of Funds Management at Folkestone Limited (ASX:FLK). This article is for general information only and does not take individual objectives into account. Please seek personal advice before making investment decisions.