The 2021 Intergenerational Report, or IGR, is Treasury’s educated guess at what Australia will look like in 2060. It should guide big policy decisions, laying a path to better outcomes in our future.
The latest IGR is notable on two fronts:
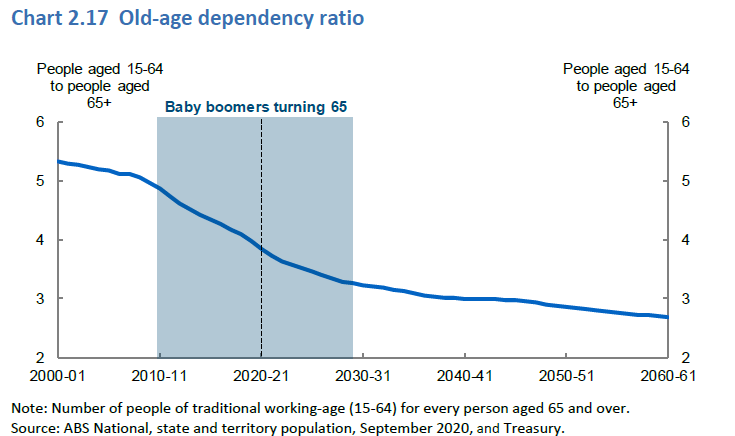
First, it comes at a time of major demographic change, with baby boomers retiring as they are now aged between 57 to 75. As recently as 1982, there were 6.6 people of working age for each person over 65. It is now 4 and in 2060 will fall to 2.7, as shown below (and someone should have a word with Treasury about labelling over 65 as ‘old-age dependency’). There will be profound implications for health, pensions, taxes and aged care.
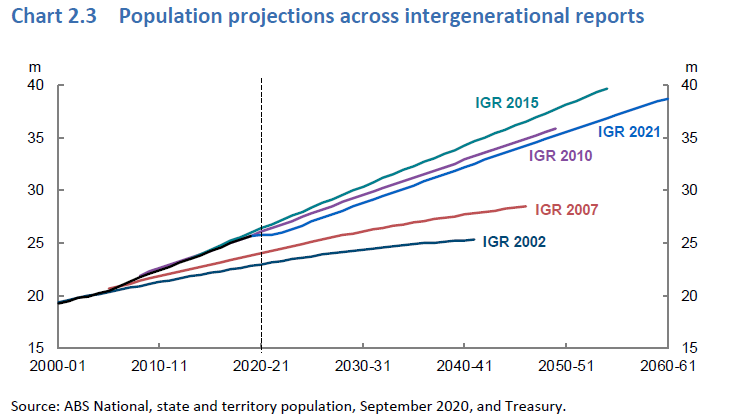
Second, the outlook for the economy and the Federal Budget over the next 40 years has been affected by COVID-19. The main impact is the smaller population due to lower migration during the pandemic. The IGR forecasts a population of 38.8 million by 2060, down from 40 million by 2055 forecast in 2015. This is the first downward population revision since IGRs started in 2002.
Treasurer Josh Frydenberg summarised the changed in this release speech, offering three key insights:
- The population is growing slower and ageing faster than expected. This impacts economic growth and workforce participation.
- The Australian economy will continue to grow but slower than previously thought. Growth will depend on productivity gains.
- While Australia's debt is sustainable and low by international standards, the ageing of our population will put significant pressures on both revenue and expenditure.
Let’s break down the 200-page IGR into population, life expectancy, budgets and debt, age pensions, government revenues and spending, superannuation and health.
1. Population
Australia has always relied on immigration to drive population growth, with fertility rates at 1.6 well below the replacement rate around 2. Low fertility and fewer young migrant arrivals will also contribute to an ageing population.
As Chart 2.3 from the IGR shows, the 2021 population projections for 2021 are below both 2015 and 2010. While migration has its impact, Treasury also highlights:
“The most significant of these trends is the fertility rate being further below the rate required to sustain the size of the population than previously projected.”
Net overseas migration accounted for about 60% of population growth in the last decade, and with lower fertility, migration is expected to contribute around 74% of growth by 2060. This depends primarily on government policy, but it shows the impact on the economy of a sustained annual intake of migrants. A strong post-pandemic recovery is forecast.
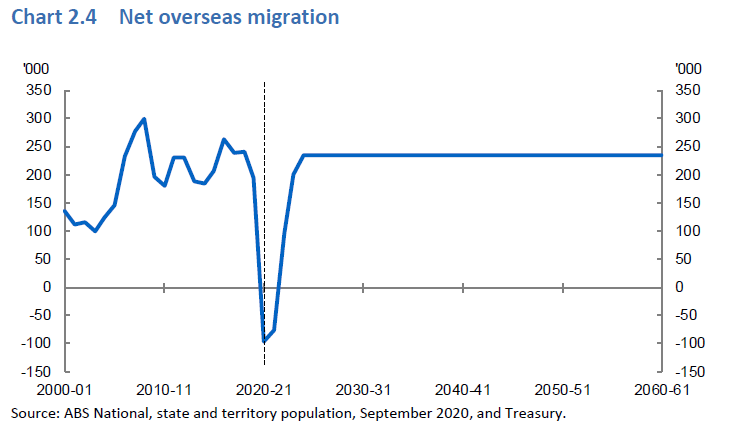
Treasury favours migration as a major factor in economic growth and recovery, although recognising the rise in health and pension costs. There is little allowance, however, for the infrastructure cost of adding 13 million people to the population. While many of these costs fall to individuals and state governments, the bulk of the financing needs to come from the Federal Budget.
2. Life expectancy and an ageing population
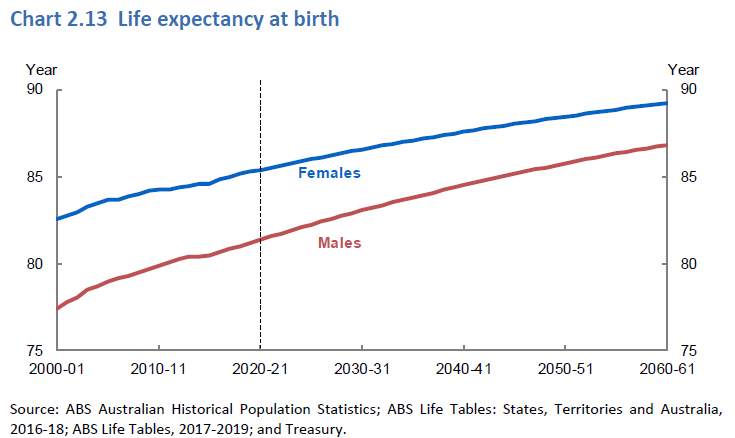
Treasury calls the ageing of the population “Australia’s greatest demographic challenge”. In fact, the life tables always underestimate actual outcomes due to faster advances in medical science than expected, and it’s more likely that most Australians born today will live beyond 90 years-of-age.
Treasury estimates that from 2020 to 2060, the number of people aged 65 and older will double to about 9 million, or 23% of the population, up from only 16% in 2020. As dramatic, the number of people aged 85 and older will more than triple to almost 2 million, representing a rise from 2% to 6% of the population. The number of centenarians will rise from the current 6,500 to over 40,900.
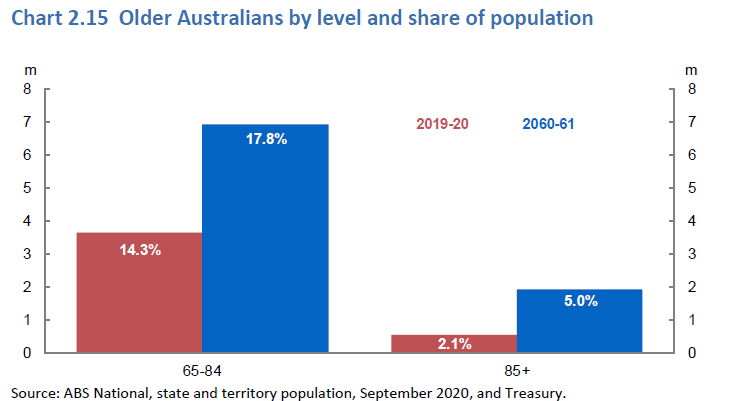
The old-age dependency ratio, forecast to fall to 2.7, presents economic growth and fiscal challenges as most taxes are paid by working-age people.
3. Budget and debt
Remember the ‘Back in Black’ budget of a couple of years ago? The green line in the chart from 2015 showed a healthy budget outlook for decades ahead. However, the pandemic’s impact leaves the underlying cash balance in deficit for the next 40 years, reaching 2.3% of GDP by 2060.
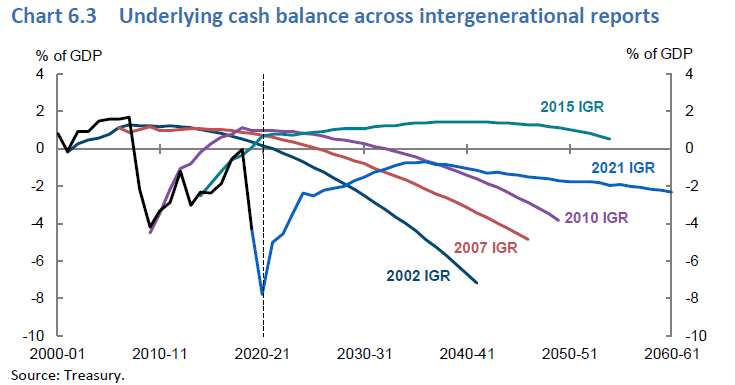
Gross debt is projected at 41% of GDP and net debt 34% of GDP in 2060. As shown in Chart 6.5 below, in the most recent 2019-20 MYEFO, gross debt was expected to fall to only 15% of GDP but is now forecast to peak at over 50% of GDP by 2030. Although the new numbers are high, the net debt is less than half the average of G20 advanced economies.
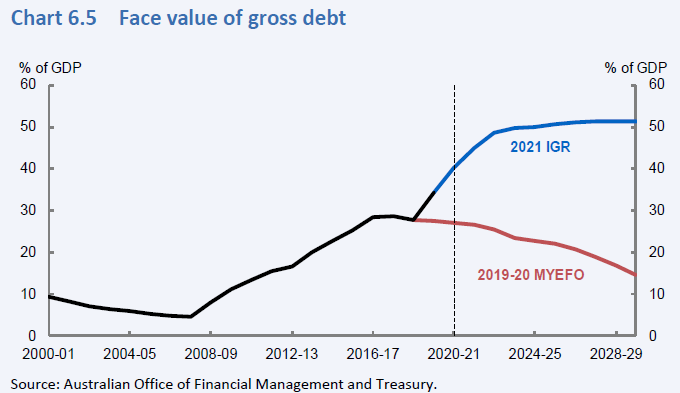
The prediction that debt will remain high for 40 years under current policy settings may at some stage lead to the fiscal repair the Treasurer is promising. He said on release of the IGR:
“But once our economic recovery is secure, we have a responsibility to again do the work necessary to restore our finances and rebuild our fiscal buffers.”
Expect to hear this message and arguments about which party is best to handle it many times during the upcoming election.
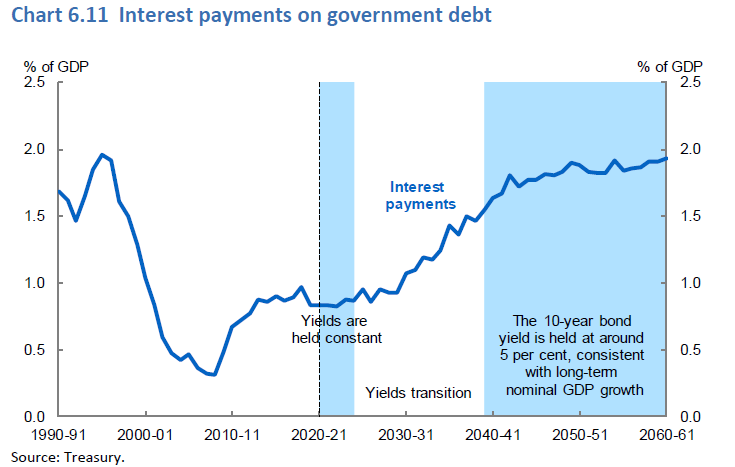
Chart 6.11 shows low interest rates are helping the affordability of the debt, at less than 1% of GDP until 2030. But from around 2040, the assumption that long-term bond rates will normalise at 5% has interest payments doubling to around 2% of GDP. Josh Frydenberg is using these numbers to justify spending to grow the economy, as the more GDP increases, the more manageable the debt seems.
4. Spending on generations
The IGR issues plenty of warnings about the demographic transition, the composition of welfare recipients and demand for services as the population ages. It highlights that spending on health and aged care will increase while payments to families and education will see a reduction in growth. Over 40 years, intergenerational tension will come to the fore.
In particular, health spending will increase from 4.6% of GDP currently to 6.2% in 2060, much of it due to the costs of new health technology. Aged care spending will rise from 1.2% of GDP now to 2.1% in 2060. However, spending on welfare such as the age and service pensions is projected to fall from around 2.7% of GDP now to 2.1% in 2060, mainly due to rising superannuation balances.
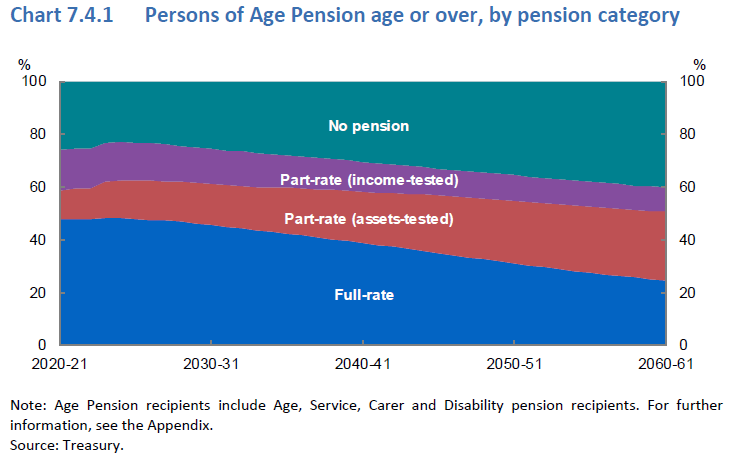
Yet, as Chart 7.4.1 shows, even by 2060, about 60% of Australians will still rely to some extent on the age pension, although full-rate pensioners will more than halve to around 25% of people. The assets test will push many onto part-pension, up about 25%, although there is no sign of inclusion of the family home in the test. Treasury emphasises that while the proportion of older Australians receiving the age pension falls by about 10%, the number of older Australians increases. There will be a doubling to 8 million by 2060 in the number of Australians of age pension age by 2060.
5. Superannuation
Superannuation assets are forecast to reach almost 250% of GDP from the current level of around 150%, with three-quarters in the accumulation phase. Annual withdrawals will move from a current 2.3% of GDP to a massive 6% in 2060. These withdrawals by retirees needing money to live on will become a major factor in the income of the nation, but balances are still expected to grow due to the size of contributions. Superannuation will remain a socially and politically divisive issue for all of our lifetimes.
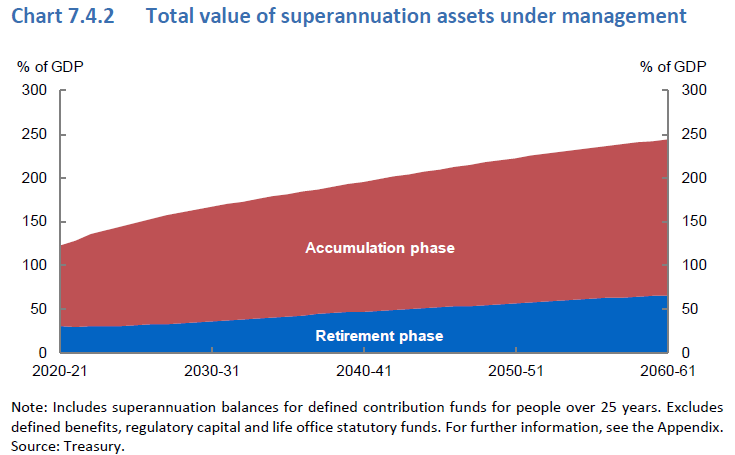
Super balances will increase significantly as the system matures, with the average amount increasing from $125,000 in 2020-21 to around $460,000 in 2060, measured in current dollars. About three-quarters of Australians will retire with balances over $250,000.
This will become the most-quoted section of the IGR:
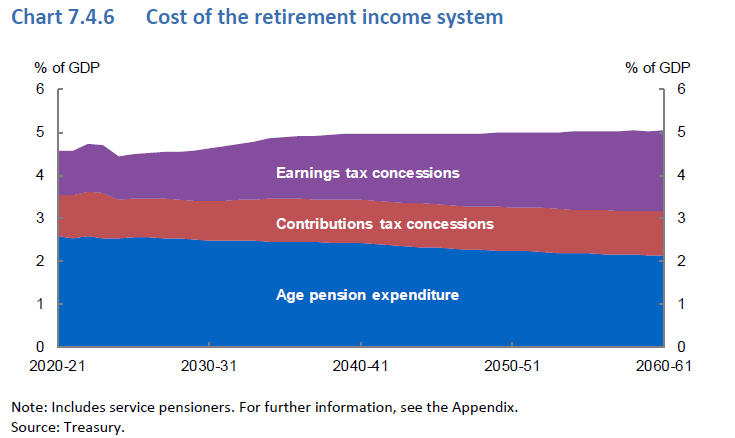
“The total projected cost of age pension expenditure and superannuation tax concessions together is expected to increase from around 4.5% of GDP in 2020-21 to 5.0% of GDP in 2060-61. As a result of the maturing of the superannuation system, government spending on the Age Pension is projected to decline as a proportion of GDP but the cost of superannuation tax concessions is projected to grow. By around 2040, the cost of superannuation tax concessions will exceed the cost of Age Pension expenditure.” (my bolding)
This final sentence will be used to illustrate the generosity of the superannuation system, especially as most of the ‘cost’ is due to high super balances for 'wealthy' people and related reduction in income tax revenues. Two points here:
- The cost of the retirement income system is mainly due to the ageing population and more people with higher balances who will support themselves without the age pension. This makes superannuation look more expensive and age pensions less expensive.
- If the superannuation tax benefits were withdrawn, wealthy people would use other methods to reduce their tax, so the budget savings would not be as great as expected.
Chart 7.4.6 below shows the increase from 4.5% of GDP to 5% in these retirement concessions.
6. Revenue
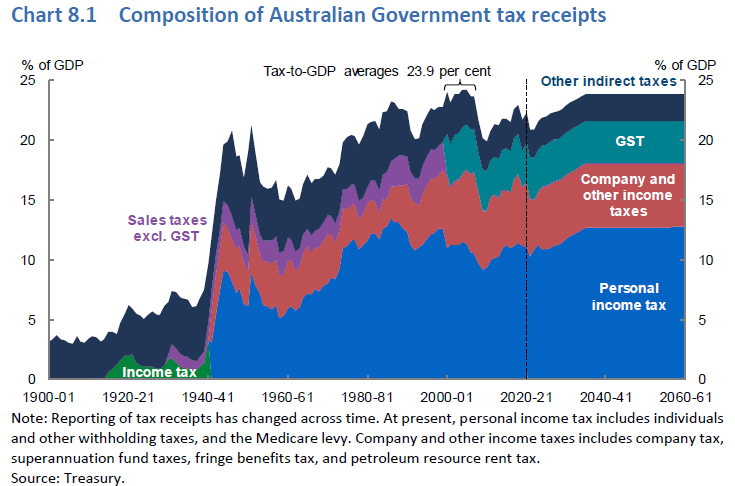
The Government has a fiscal strategy to maintain the tax-to-GDP ratio at or below 23.9%, and the IGR is developed using this ratio. It is already at the high end of the Australia’s tax-to-GDP ratio range of 20 to 25% of GDP over the past 30 years.
A major policy area over coming decades will be whether the reliance on personal tax shown in Chart 8.1 should continue, or is it a disincentive to work? This chart will be used to make the case for a higher GST.
It's better than the alternative
A growing population living longer needs good policies to accommodate it, and Australia has the capacity to manage the change, although the days of budget surpluses are long gone.
However, there are worries that Australia is reluctant to reform the economy to drive the next gains in productivity. The IGR assumes productivity growth at 1.5% a year, the average of the last 30 years, but annual growth was only 0.5% over the five years before the pandemic hit.
There are obvious strains on future budgets. One quarter of government expenditure will be on health, and as measured by Treasury, superannuation will cost more than welfare pensions. Expect concessional tax treatment for super to face further reform.
Two major shortcomings are evident reading through the IGR. For all its discussion of intergenerational tension, there is no mention of declining rates of home ownership. There is no greater contribution to a secure retirement than the ability to stay in the home you own, but what was once considered a basic right is now beyond many people.
And while climate change is regularly cited as a major long-term concern of most Australians, there is no insight into how the Government plans to manage the next 40 years.
Overall, the IGR confirms Australia is well placed, with lower debt to GDP than other developed countries and the capacity to spend on health and welfare. And living longer is better than the alternative.
Graham Hand is Managing Editor of Firstlinks.