To reap big rewards in stocks, history shows you must accept the drawdowns.
Investors have been promised an elixir of big returns and low volatility. But the truth is that to achieve outstanding long-term returns, investors must be prepared to endure large drawdowns along the way – even for the best-performing stocks and portfolios.
While the selloff in global equity markets early this year was unpleasant, it was not unusual. Instead of raising alarm, it has been a great reminder that investors need to stay the course with winning businesses – the likes of Apple and Amazon - if they want to reap great rewards in the future.
Even the best stocks have big falls
In July 2020, Hendrick Bessembinder, a finance professor at Arizona State University, published a series of papers with an important and surprising conclusion: that even the stocks of companies that had created the most wealth for shareholders over a decade experienced deep and protracted share price reversals along the way – often several times.
Bessembinder had become well-known after he demonstrated that all the stock market’s value creation over the long run was concentrated in just a few stocks with extreme outperformance.
His more recent research focussed on the characteristics of those ‘outlier’ stocks, including their interim share price movements.
Bessembinder studied the wealth creation of all publicly listed US stocks across each of the seven decades from 1950 to 2019. He then concentrated on the top 100 performing stocks, measuring their maximum peak-to-trough share price drawdowns.
He found that, on average, the most successful 100 stocks created US$219 billion of wealth over a decade-long horizon. However, shareholders had to endure a maximum drawdown in the same decade of 33% that lasted for 10 months.
Those shareholders that invested earlier in these top stocks, in the decade preceding their decade of greatest performance, would have suffered a maximum 52% drawdown lasting 22 months, on average, on their way to extreme wealth creation.
Apple and Amazon the rule not the exception
Apple and Amazon are two striking examples of remarkable companies with exceptional long-term stock performance that have been accompanied by staggering drawdowns.
Apple has created the most wealth

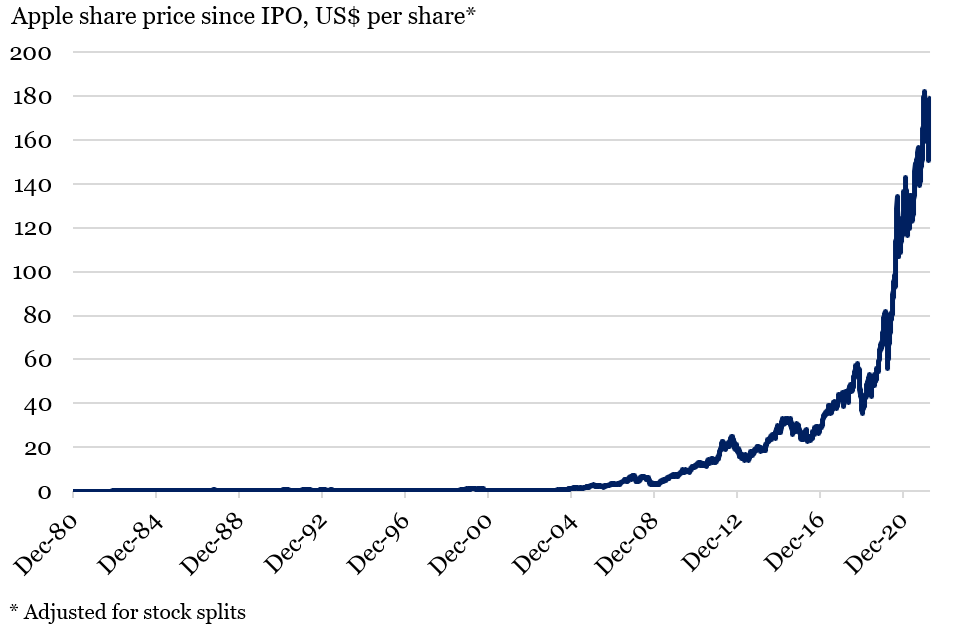
Apple created the most wealth in a decade of all the companies in the study, adding US$1.5 trillion of shareholder value from 2010 to 2019. But this hasn’t stopped the stock from making substantial retracements. For example, in this decade Apple’s share price fell by 40% over 9 months in 2012.
Looking back further, shareholders since Apple’s IPO in 1980 have earned a compound annual average return of 22% but have experienced drawdowns of more than 70% on three separate occasions.
Apple has drawn down over 70% three times

Amazon is another of the most successful investments in history and the fourth-highest performer in the Bessembinder study, with shareholder wealth growing by more than US$600 billion between 2010 and 2019.
Still, Amazon stock has not been impervious to very large drawdowns. Although shareholders from the 1997 IPO have made compound annual average gains of 36%, they also suffered through the dot-com crash of the early 2000s when Amazon’s share price fell by a gut-wrenching 91%.
A perfect portfolio isn’t pain-free either
Some investors would be quick to point out that while these companies may be the best of the best, they are still just individual stocks, and a portfolio approach should limit the drawdown risk. Unfortunately, the research shows otherwise.
Wesley Gray, PhD, an asset manager and former US Marine, published a paper in 2016 concluding that a hypothetical stock portfolio constructed with perfect foresight would deliver stratospheric long-term returns … but still could not avoid agonizing drawdowns.
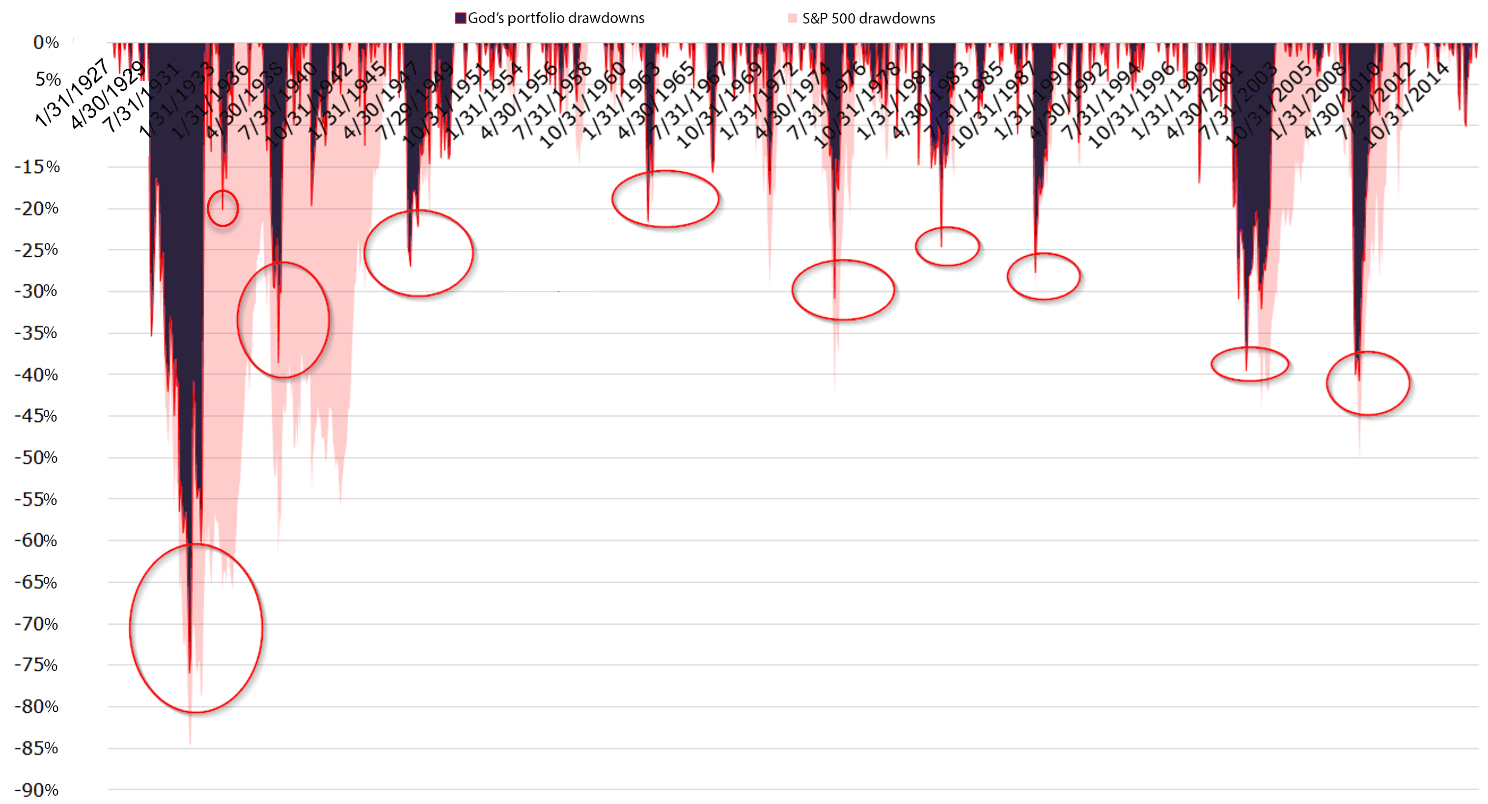
Gray created what he called ‘God’s portfolio’ which invested exclusively in the top decile of stocks based on their performance over the next five years. After five years he rebalanced the portfolio to invest only in the top performers for the next five years, and so on. He ran this exercise from 1927 to 2016 covering the 500 largest publicly listed stocks in the US.
Over the 90-year investment horizon, God’s portfolio compounded at more than 29% per year which would have turned an initial investment of just $1 into almost $12 billion! (The S&P500 index of the top 500 US listed stocks returned on average just under 10% per year in this time and a $1 investment would have grown to about $5,000.)
While the theoretical value created by God’s portfolio is no doubt staggering, the drawdown profile is more astonishing. Instead of protecting against large reversals in fortune, God’s portfolio endured the pain of drawdowns that exceeded 20% on ten different occasions. The worst of these was a 76% decline over almost three years in the Great Depression – not dissimilar to the stock market’s 85% drawdown around the same time.
‘God’s portfolio’ still has large drawdowns
Drawdowns since 1/1/1927, per cent

Clearly it is impossible to create Gray’s divine portfolio in the real world but that’s the point. Knowing which stocks to select in a portfolio based on the returns they will achieve with certainty would deliver exceptional long-term gains. But only if investors could stay invested through the short-term pain.
The Oracle has drawdowns too
Back in reality, Warren Buffett is often seen as the closest to perfection in the investing world. The Oracle of Omaha’s performance as the Chairman of Berkshire Hathaway has been phenomenal over a long time. Yet Buffet has also been unable to escape gruelling drawdowns.
From 1980 to 2016 Berkshire’s stock price appreciated at an average annual rate of 20%, far outpacing the 10% achieved by the S&P500 index. The difference in total return is starker. This means that Buffett presided over a 700-fold increase in shareholder value while the broader index increased 31 times.
Extraordinary returns were not, however, associated with restrained drawdowns. Over the course of 36 years Berkshire stock pulled back by at least 30% on four occasions. Relative to the market these losses were sometimes shocking. For example, in the dot-com boom Berkshire fell by 44% at the same time as the stock market advanced by 23%, representing 67% underperformance.
What to do?
So, when Apple, Warren Buffett and God can’t eliminate drawdowns, what are investors to do?
The most important lesson is that investors should identify long-term winning businesses that are undervalued and own them for the long term too. Staying the course has been critical to realising the powerful compound returns of the best companies even, or especially, as they experience large drawdowns from time to time.
In fact, AQR, one of the world’s largest hedge funds concluded the same following a study of Buffett’s performance over decades. Cliff Asness, CEO of AQR, said:
“What was beyond human was him [Buffett] sticking with it for 35 years and rarely, if ever, really retracting from it. That was a nice little lesson that you have to be good, even very good, but sticking with it and not getting distracted is much more the job”
Sell-offs and drawdowns are difficult. But if investors take a long-term view, as we do at Montaka, they are the price you pay to benefit from the powerful, wealth-building compounded returns from equities and the stocks of remarkable companies.
Chris Demasi is a Portfolio Manager at Montaka Global Investments, a sponsor of Firstlinks. This article is general information and is based on an understanding of current legislation.
For more articles and papers from Montaka, click here.