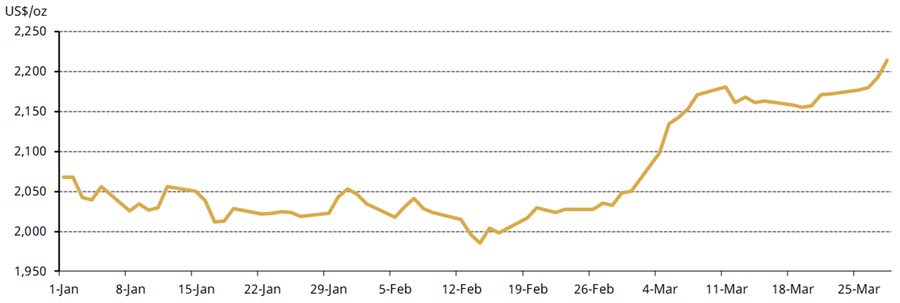
The gold price shot up since the end of February, with the LBMA Gold Price PM closing at US$2,214.35/oz as of 28 March – a 8.1% increase m/m.[2] Gold broke record highs multiple times during March, trading above US$2,200/oz intra-day a few times during the month and eventually exceeding that level by the end of the month (Chart 1). Gold behaved similarly in Australian dollars where gold reached a new all-time high of AUD$3,396/oz, an increase of 7.7% m/m (Table 1).
Chart 1: Gold reached new highs in early March
LBMA Gold Price PM in USD per ounce*

*As of 28 March 2024.
Source: Bloomberg, ICE Benchmark Administration, World Gold Council
Table 1: Gold had a strong March, reaching new highs in multiple currencies
Gold price and returns in key currencies*

Gold’s sharp increase has since caught the attention of market participants. The initial trigger was linked to a weak ISM print in the US on 1 March,[3] pushing bond yields down. Gold’s positive trend was further cemented following the US Federal Open Market Committee (FOMC) meeting on 20 March. Market participants generally took the Fed statement and Powell’s comments as dovish, resulting in strong performance of many asset classes – including gold – on the prospects that the Fed may start cutting rates in June. Lower rates reduce the opportunity cost for holding gold.
But rates speculation can only explain so much, so what’s behind gold’s move since?
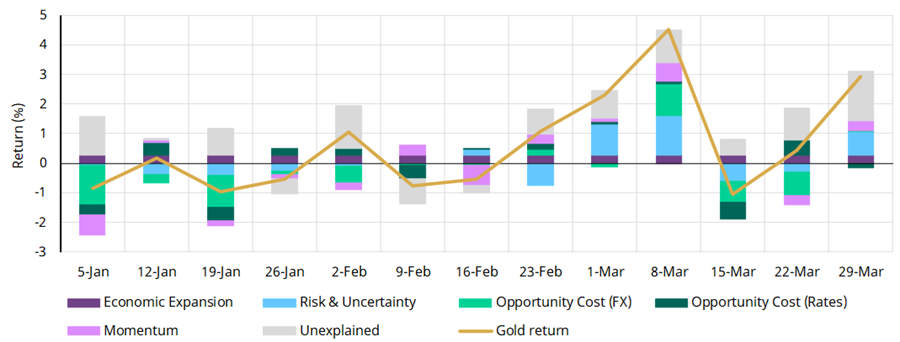
Our analysis, using a weekly version of our Gold Return Attribution Model (GRAM), indicates that gold’s performance can partly be explained by a few factors (Chart 2):
- Movements in the US dollar – specifically weakness against both developed and emerging market currencies early in the month.
- An increase in gold’s implied volatility that wasn’t accompanied by a rise in bond implied volatility, suggesting that investors were expecting wider relative price movements in gold but not as much in other assets like bonds.
- More bullish COMEX investor positioning (futures and options for gold) and positive gold ETF investment flows in North America and Asia.
Chart 2: Gold’s recent move can be partly explained by the USD, risk and momentum
Key drivers of gold’s return by week*

*Data to 29 March 2024. Our Gold Return Attribution Model (GRAM) is a multiple regression model of weekly gold price returns, which we group into four key thematic driver categories of gold’s performance: economic expansion, risk & uncertainty, opportunity cost, and momentum. These themes capture motives behind gold demand; most importantly, investment demand, which is considered the marginal driver of gold price returns in the short run. ‘Unexplained’ represents the percentage change in the gold price that is not explained by factors already included. Results shown here are based on analysis covering an estimation period from 2 April 2021 to 29 March 2024.
Source: Bloomberg, World Gold Council
There is, however, a good portion of gold’s recent performance that can’t be explained by GRAM, which – as with any other model – depends on the strength of historical relationships. As such, there are a few other factors that may explain the additional increase.
Firstly, gold’s rapid increase and its surge above a series of technical resistance and psychological levels ranging from US$2,050 toUS$2,200/oz likely served as a catalyst to cover short option strategies and drove further tactical investor interest. COMEX net long positioning – used by GRAM comes with a lag and may not yet capture this data, although it could be inferred by more timely information on Open Interest.
Secondly, there’s also activity in the less transparent over-the-counter market that may not be reflected in COMEX positioning or gold ETF flows but that likely provided further fuel to the market.
What’s next?
The key question now is how sustainable gold’s rally is.
On the plus side, gold started March aided by strong Chinese demand during the Spring Festival. Data from the Ministry of Commerce shows that gold and jewellery sales in China – dominated by gold products – rose by 24% y/y during the holiday. And in Shanghai, gold consumption exceeded RMB1bn (US$141mn), a 14% rise y/y. Many other regions also experienced similar, if not stronger, growth in gold jewellery sales, according to the Ministry of Commerce and various news reports. In fact, data indicates that gold consumption during the period would have been stronger had it not been for wallet share competition from travel and other entertainment options.
And central banks have continued with their buying spree in 2024. Central banks have reported adding 64 tonnes over January and February; while lower than the same period in 2023, this is four-fold their level of buying during the first two months of 2022. We have highlighted in previous reports that gold’s strong performance over the past few years can be partly explained by geopolitical risk as well as robust central bank purchases – which are often reported with a lag.
Finally, investor flows may bring additional support. March already saw positive flows in physically backed gold ETFs in North America and Asia. And positioning in derivatives markets may bring additional investment if the gold price remains above key psychological levels such as US$2,100/oz or US$2,200/oz. Overall, we believe that gold’s recent rally has happened while gold remains under-owned, which can create positive support if either rates fall or financial conditions deteriorate.
On the flip side, the upcoming US Federal Open Market Committee meeting in late April/early May will shed further light on the Fed’s appetite to loosen monetary policy.[4] And while the market is not currently expecting a rate cut until June, a more hawkish stance by the Fed may create short-term headwinds for gold.
In addition, rapid gold price movements typically discourage gold jewellery consumers, who may choose to wait for volatility to subside. Further, demand in India is unlikely to see a notable uptick in the next couple of months, as the country’s upcoming general elections (from April to June), will see the movement of cash, gold, and jewellery face heightened scrutiny. Anecdotal evidence suggests that the various stakeholders in the industry – bullion dealers, manufacturers, and jewellers – tend to limit their transactions during this period. As a result, data suggests that gold consumption has fallen during three of the last four general election periods. However, some improvement in demand could be expected around the time of Akshaya Tritiya (10 May),[5] as this is traditionally considered to be an auspicious time to buy gold.
Juan Carlos Artigas is Global Head of Research at World Gold Council, a sponsor of Firstlinks. This article is for general informational and educational purposes only and does not amount to direct or indirect investment advice or assistance. You should consult with your professional advisers regarding any such product or service, take into account your individual financial needs and circumstances and carefully consider the risks associated with any investment decision.
For more articles and papers from World Gold Council, please click here.
[1] As of 11 March 2024, based on the LBMA Gold Price PM USD.
[2] The LBMA Gold Price does not trade on 29 April in observance of Good Friday: Value Dates | LBMA.
[3] US manufacturing contracts further, rays of light on the horizon | Reuters.
[4] Feb US payrolls show labor market healthy but not overly tight | Reuters.
[5] Aakshaya Tritiya: All about Akshaya Tritiya: Date, Timings & Significance - The Economic Times (indiatimes.com).