Cliff Asness isn’t widely known yet he’s a legend in the investment industry. He joined Goldman Sachs Asset Management while doing his PhD in finance in 1990. There, he set up a quantitative research unit to build on the ‘factor’ models created by his academic mentor, Nobel laureate, Eugene Fama, and economist Kenneth French.
In 1995, Asness with some Goldman colleagues formed a fund to invest in the market, and three years later, he co-founded the quantitative hedge fund firm, AQR. Today, AQR has about US$100 billion in assets under management.
Recently, Asness penned a paper called The Less-Efficient Market Hypothesis, which will soon appear in The Journal of Portfolio Management. In the paper, Asness outlines why he thinks the market has become less efficient during his 34 year career, and what investors can do about it.
Stock prices should accurately reflect reality but often don’t
Asness says it’s important that stock prices accurately reflect reality. That’s because a well-functioning economy needs a well-functioning capital market, and stock prices are important because they provide incentives for how society allocates resources. If prices are too high or low, that has real-world consequences for resource allocation and ultimately productivity and the economy.
The ’efficient market hypothesis’ (EMH) has been central to the debate of a well-functioning stock market. Put simply, EMH suggests that asset prices reflect all information and the market is thus very efficient.
That’s long been disputed by Asness and others, and hypothesis architects such as Eugene Farma have admitted that markets are not perfectly efficient, though they’re close enough.
If you accept the premise that markets aren’t perfectly efficient, then the question becomes just how efficient are they? Asness believes they have gotten less efficient over his career.
It’s fine for Asness to put forward this argument but can he prove it? Even he admits that tests of EMH are difficult and controversial, and tests of how much it’s changed are harder still. Asness says his paper is as much an op-ed as it is quantitative research, though he “thinks it’s an accurate op-ed!”
Before getting to the evidence to support his opinions, Asness puts to bed the contention that the ubiquity and speed of information has made the markets more efficient. He says it mistakes speed for accuracy. Speed doesn’t imply the level of prices before or after new information becomes available is accurate or otherwise, he says.
The evidence
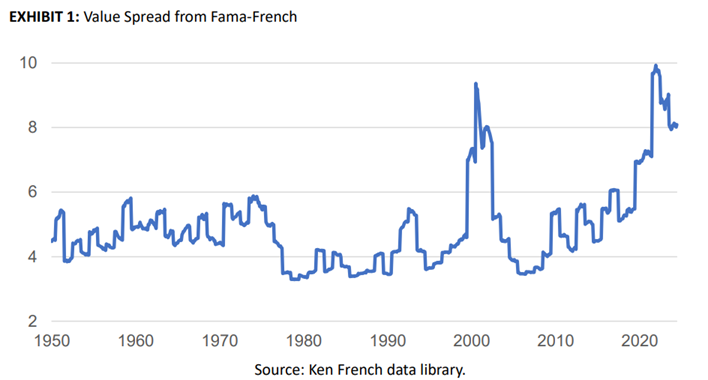
To validate his theory, Asness presents three charts. The first is the ratio of the valuation of expensive stocks to cheap stocks. When it’s high, investors are paying a lot for their favourite stocks compared to those they dislike, and vice versa.
The below chart is the price-to-book of the most expensive 30% of large-cap stocks divided by that of the cheap 30% of large-cap stocks.

As you can see, the ratio didn’t deviate a lot from 1950 to the late 1990s, ranging between 3 and 6x. Then it went bananas during the dot-com bubble before plummeting again. It got back to 2000 levels, and beyond, in 2019-2020, and now remains at relatively high levels.
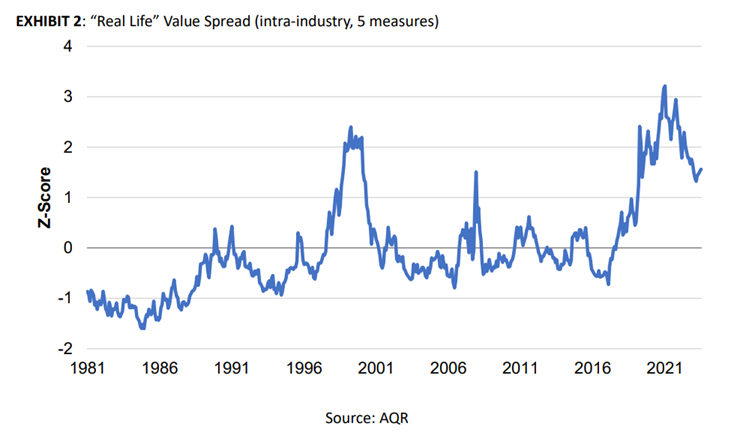
Asness anticipates critics of the above chart suggesting price-to-book is just one valuation, and that it may not be an accurate one given the rise of tech stocks and the intangible assets attached to them.
So, he also provides data using five measures of value, including book-to-price, cash-flow to price, trailing earnings to price, forecasted earnings to price, and sales-to-enterprise value. Again, it plots expensive against cheap stocks.

It yields similar results to the first chart.
Asness acknowledges that so-called value spreads are informative, though aren’t conclusive. He looked further into why the spreads are high now. Is it because of some anomaly? Perhaps the rise of technology stocks? Nope, he ruled that out. Perhaps from more intangible assets not being included in traditional valuation metrics? No. Perhaps because of the super expensive mega cap stocks? No. Perhaps low interest rates are to blame? No again. Asness couldn’t find an anomaly to explain recent high value spreads.
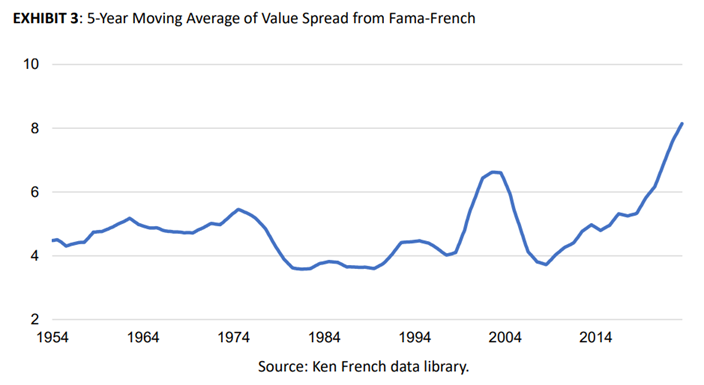
In addition, he looked at the duration of these value spreads. He took the first chart and applied a five-year moving average. And he notes that other versions such as his own come up with similar results.

The chart shows we’ve had 10 years with spreads above the median, and for much of it at great magnitudes.
Asness’ conclusion is that if “these very wide value spreads represent market inefficiencies, they aren’t just more extreme than in the past, but they are lasting longer when extreme”.
The question then becomes: why?
Possible explanations
Ansess puts forward three possible explanations for markets becoming more disconnected from reality. He prefaces them by saying that none are conclusive and other people may have further ideas. That said, here are the potential explanations:
1. Indexing has ruined the market
Indexing has coincided with increasing inefficiencies in the market, though correlation doesn’t equal causation. Asness says there is evidence and a reasonable argument that the rise of indexing has made stock prices more inelastic. That is, prices have to move more in response to changes in desired quantities (a trade moves prices more).
Asness admits there’s no proof of value spreads being directly linked to indexing, and more research is needed into the issue.
2. Low interest rates
Low interest rates weren’t prevalent during the dot-com period, which immediately causes a problem for this explanation. However, Asness believes that low rates do impact market valuations:
“… it certainly feels like it could be a serious contributing factor among other conditions in making investors lose their minds (a more colloquial definition of a bubble). Sorry I can’t be more formal/specific here, but I’m going to stock with “very low, even negative, real rates over long periods might drive investors to do batty things.”
Not much evidence here.
3. The gamification of markets via social media
Asness suggests this is the best of the possible explanations. His theory is that technology has hindered rather than helped market efficiency. It’s done this by turning market participants who would normally act independently of each other (the wisdom of crowds) into a coordinated, often ill-informed gang:
“… has there ever been a better vehicle for turning a wise, independent crowd into a coordinated clueless even dangerous mob than social media? Instantaneous, gamified, cheap, 24-hour trading now including “one-day funds” on your smartphone after getting all your biases reinforced by exhortations on social media from randos and grifters with vaguely not-safe-for-work (NSFW) pseudonyms filtered and delivered to you by those companies’ algorithms which famously push people to further and further extremes. What could possibly go wrong?”
Implications for investors
Asness is principally a value-based quantitative investor and he looks at the issue through that lens. He thinks value strategies are the best way to take advantage of the increased market efficiencies. However, given the cycles of irrational market pricing are lengthening, these strategies will have periods of underperformance that are more severe and longer lasting. In other words, there’s a lot of money to be made but investors need to take a long term view.
What are most investors doing about it? Not much…
Asness says most investors aren’t doing anything to take advantage of increased market inefficiencies. Instead, they’re crowding into indexing. Asness doesn’t criticize those doing this, as it makes sense if you don’t want to play the game of ‘taking on the market to beat it’.
The other thing that investors are doing is flooding into private assets. Asness has long been a critic of private investing, especially of its transparency and valuation practices. He coined the term ‘volatility laundering’ to describe those that don’t properly mark-to-market their valuations and essentially ‘hide’ from the volatility of public markets.
What investors should be doing
Here’s the disappointing part: Asness doesn’t offer much concrete advice about how to take advantage of opportunities from increasing market inefficiency. Given the longer duration of pricing cycles, he says that investors should lengthen their time horizons – which isn’t very helpful.
A better point he makes is that investors should think carefully about matching their portfolios to their time horizons. All the research indicates that momentum and trend following strategies are strongest over 6-12 month periods. At a 3-5 year horizon, being a mild contrarian works best.
Unfortunately, that doesn’t really tie back to his original premise of markets becoming less rational and creating more opportunities.
My two cents
What do I make of Asness’ theories? I think efficiency of market pricing happens in cycles – sometimes they’re more efficient, sometimes less. Right now, we appear to have the latter. Some of his reasons for current market valuations seem plausible, albeit inconclusive.
There are parts of the market which appear to have been left for dead by the momentum-driven, trend following, and gamified investors of today. Value stocks, international markets outside of the US, and small caps come to mind. I’ll speak more to these neglected areas of the market in another article soon.
James Gruber is the Editor of Firstlinks.