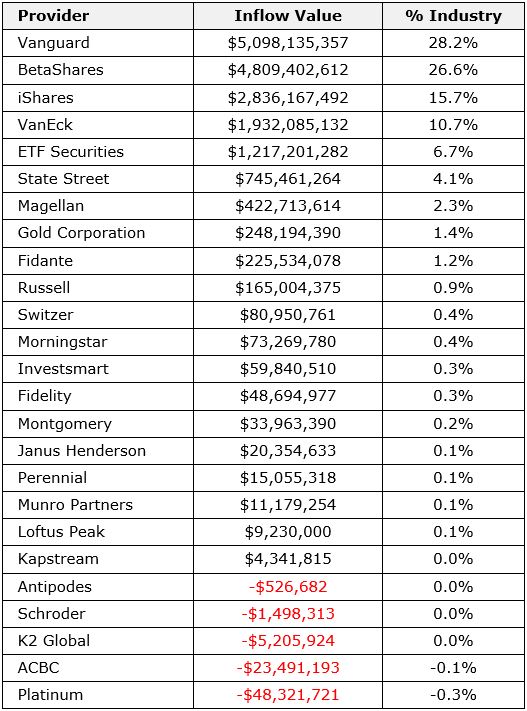
This article is an extract from the BetaShares Australia ETF Review for November 2020. There are now 257 Exchange Traded Products trading on ASX and Chi-X.
Firstlinks regularly includes monthly and quarterly ETF reviews in its Education Centre, and we are highlighting ETFs this month due to the historic milestones:
- November 2020 saw industry records broken for absolute Funds Under Management (FUM), absolute dollar monthly FUM growth, annual growth in FUM and largest net flows on record amongst others
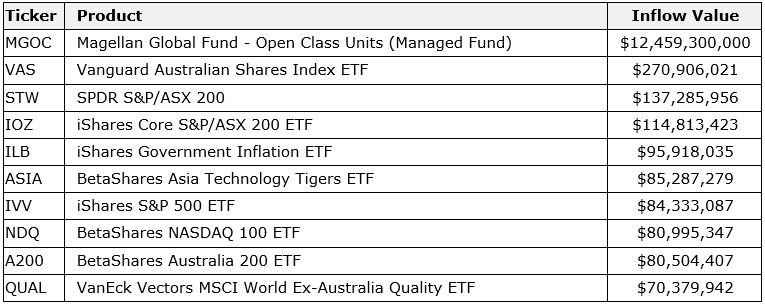
- A notable event this month was the conversion of Magellan’s Global Fund into an ‘Open Class’ structure which permits applications and redemptions both on and off market. The entire $13.5 billion in that strategy has been ‘ported’ across to the ETF industry data. We’ve included the converted fund for FUM purposes in the numbers below but, given it’s a structural change not a net flow, have excluded from the monthly flow figures
- Including this conversion the industry’s market cap is now $92.3 billion, although, even without it, the industry rose to a record high of $78.7 billion, representing an almost $5 billion monthly FUM increase, smashing the previous record of $4.1 billion recorded in January 2020
- For the third month in a row, the Australian ETF industry broke its all-time net flows record, receiving $2.5 billion of net flows, surpassing the previous record from last month ($2.3 billion)
- Including the Magellan conversion, industry growth over the last 12 months has been 52%, representing absolute growth of $31.6 billion over this period
- With sharemarkets rallying strongly in November, we saw an almost even mix between asset value appreciation and net new money.
- Trading value remained strong with ~$8.3 billion traded which represented a 19% month-on-month growth
- Three new products were launched this month, all of which were Active ETFs. Apart from Magellan’s conversion, new funds were launched by Munro and Loftus Peak in the global equities space
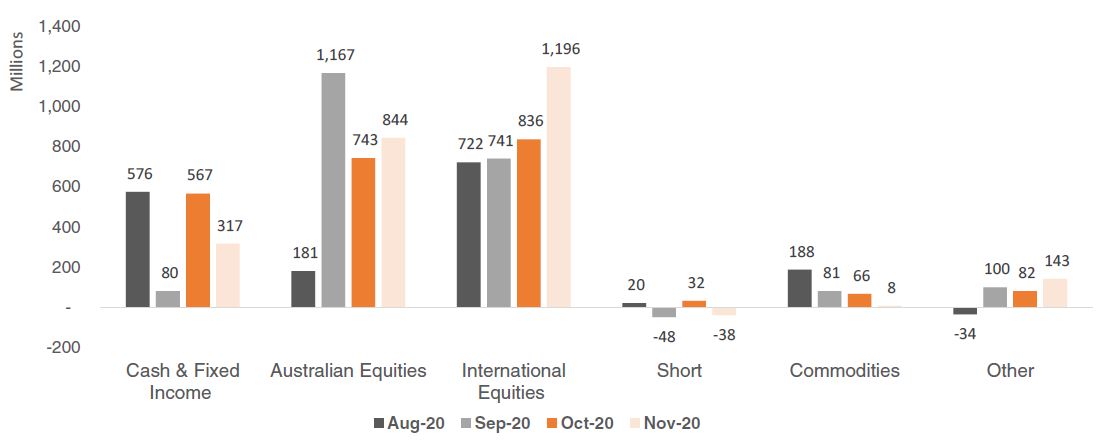
- As has been the case since the COVID crisis, equities exposures dominated net flows this month, and this month, particularly the case with international equities ($1.2 billion of net flows).
- We saw outflows in cash and short exposures, both of which may be the result of markets rallying and investors positioning for a risk-on allocation.
Figure 1: Australian ETP Market Cap: August 2001 – November 2020
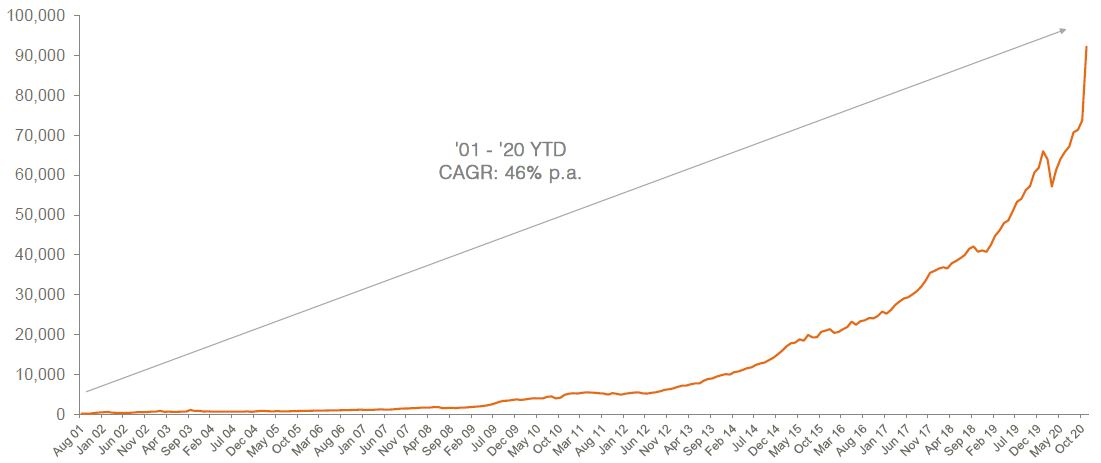
CAGR: Compound Annual Growth Rate. Source: ASX, Chi-X, BetaShares. Note, in November 2020, Magellan restructured a large international unlisted exposure to an open class structure and this fund (MGOC) will be included in ETF figures going forward.
Top 10 Products: November 2020
By Market Cap
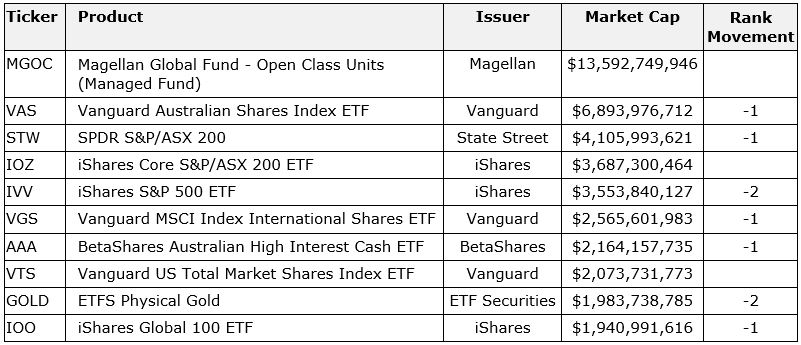
Other products with > $1B AUM: VAP, VEU, IAF, VAF, VHY, QUAL, MVW, NDQ, VGAD, A200
Top 10 Inflows (by $) - Month
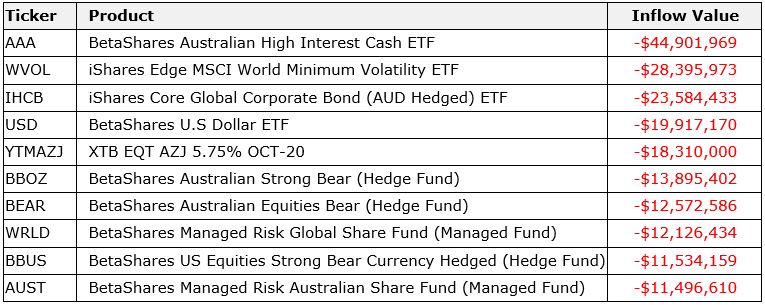
Top 10 Outflows (by $) - Month
Top 5 Category Inflows (by $) – November 2020

Top Category Outflows (by $) – November 2020

Figure 2: ASX ETF Flows by Asset Class - Last 4 Months (A$m)
Top 5 Sub-Category Inflows by ($) – November 2020

Top Sub-Category Outflows by ($) – November 2020

ETF Issuer Flows – YTD 2020
