It is popular to hate on the US stock market and predict an end to its extended dominance, even as inflows continue apace. But bull markets don’t die of old age. There has to be a reason.
In this article, I set out five reasons why now might be the time to downgrade exposure to US stocks (specifically, large caps). However, it would be unbalanced to not also consider valid arguments in the other direction. I highlight six here.
Whichever side of the debate you sit on, you should challenge yourself by considering the other, rather than blithely discounting it. Could US stock market exceptionalism continue?
The arguments against investing in US stocks
1. US valuations are uncomfortably high
US cyclically-adjusted price-earnings multiple (CAPE)
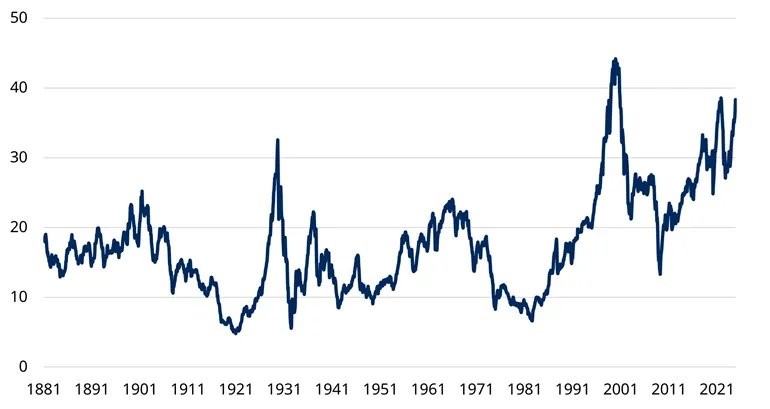
CAPE = price divided by 10-year average earnings, in inflation-adjusted terms. Data January 1871-November 2024. Source: Robert Shiller, Schroders.
Outside the peak of the dotcom bubble, US valuations are close to their most expensive in the past 143 years.
The chart above shows the cyclically adjusted price-earnings multiple (which compares prices with average earnings over the previous 10 years) but we could have equally made the same argument using other valuation measures and over shorter time horizons.
Although not a new argument, this year’s rally has propelled valuations to uncomfortably high levels.
2. US valuations are stretched to the extreme vs other stock markets
While the US is at levels which historically would have been bubble territory, valuations elsewhere are actually quite reasonable.
The chart below shows a composite valuation indicator for five major stock markets, with degrees of expensiveness/cheapness averaged across five individual measures: CAPE, trailing price/earnings, forward price/earnings, price/book, dividend yield. These are calculated on a “z-score” basis, which adjusts for differing variability of the individual measures to make them more comparable.
Outside of the US, valuations are close to fair value when compared with history. It is only the US which is extended.
Non-US valuations are reasonable, the US has become more expensive in absolute and relative terms
Composite valuation metric = Average z-score* across five valuation metrics
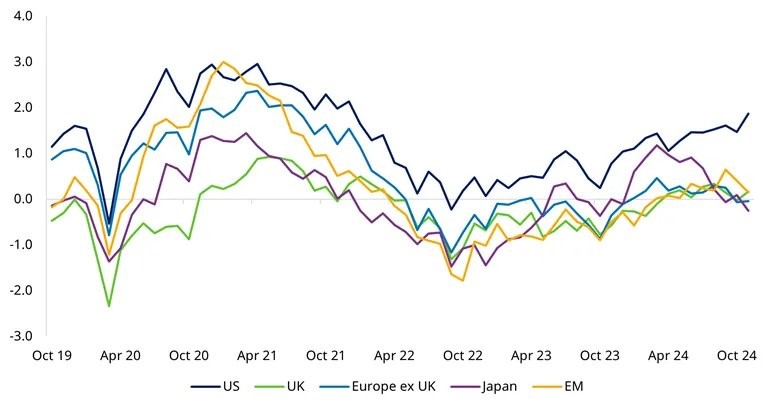
*Z-score measures the number of standard deviations above or below the average. Our assessment of expensive/cheap is relative to a 10-year rolling average of each market across five valuation metrics: cyclically-adjusted price-to-earnings, forward P/E, trailing P/E, P/B and dividend yield. Source: LSEG Datastream, MSCI and Schroders. Data to 30 November 2024.
The consequence is that, on a relative value basis, other stock markets are valued at historically cheap levels compared with the US. The MSCI World ex US index trades at a near-50% discount to the US, in terms of trailing price/earnings multiple. Within the US, small caps have also fallen to a sizeable discount to large caps. Historically they’ve traded at a premium, reflecting their typically stronger expected growth rates.
This is not simply a result of US large caps having a larger allocation to the highly-rated technology sector. Almost every industry group among international stocks trades at a significant discount to the US. The median discount is 27%.
Non-US markets are historically cheap vs the US
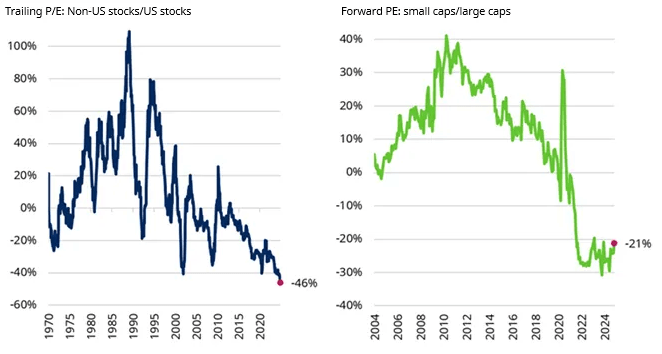
Left hand chart: Non-US stocks are MSCI World ex-US index, US is MSCI USA; right hand chart: small caps are S&P 600 index, large caps are S&P 500. Different indices and time horizons are used in the two charts for reasons of data availability. Source: LSEG Datastream, MSCI, S&P, and Schroders. Data to 30 November 2024
3. Strip out the Magnificent-7 and European companies have been almost as good at growing earnings as US ones
Next 12-month earnings, US in USD, Europe ex UK in EUR, indexed to 100
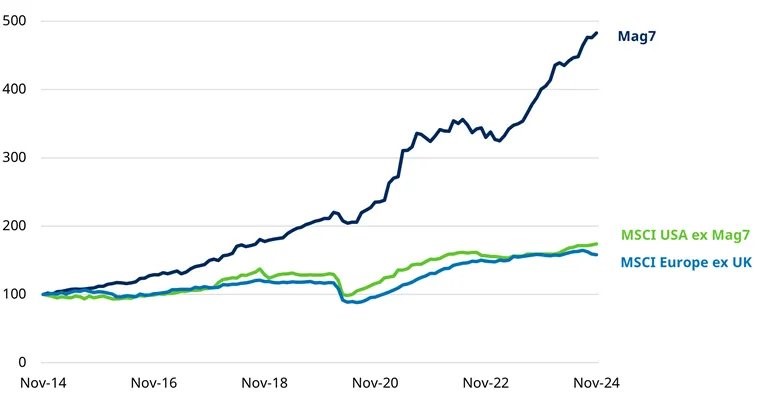
The Magnificent-7 is the name given to Amazon, Alphabet, Apple, Meta Platforms, Microsoft, Nvidia, and Tesla. Source: LSEG Datastream and Schroders. Data covers ten years to 30 November 2024.
European companies come in for a lot of criticism compared with their US peers but, over the past decade, they’ve competed favourably with most US companies in generating earnings growth. The shortfall has been against the Magnificent-7 of Amazon, Alphabet, Apple, Meta Platforms, Microsoft, Nvidia, and Tesla. They have significantly outperformed European companies, but that is not true of the rest of the US market.
So downbeat is sentiment towards non-US stocks, that you’d think the US is the only market where companies are expected to perform well. That blinkered view risks leading to missed opportunities. Around half of European and Japanese companies are forecast to deliver double digit earnings growth in the next 12 months, a slightly higher figure than in the US. The UK is not far behind on 44%.
4. US consumers are the most bullish about stock prices in at least 40 years
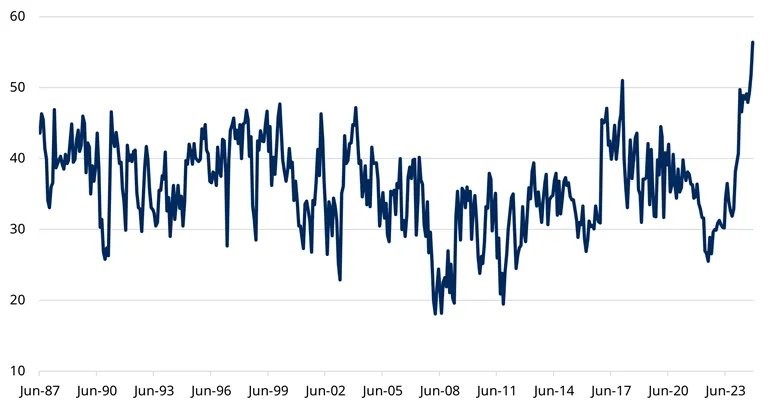
Conference Board survey: US consumers expecting higher stock prices in the next 12 months, %
Source: The Conference Board, LSEG Datastream and Schroders. Data to November 2024.
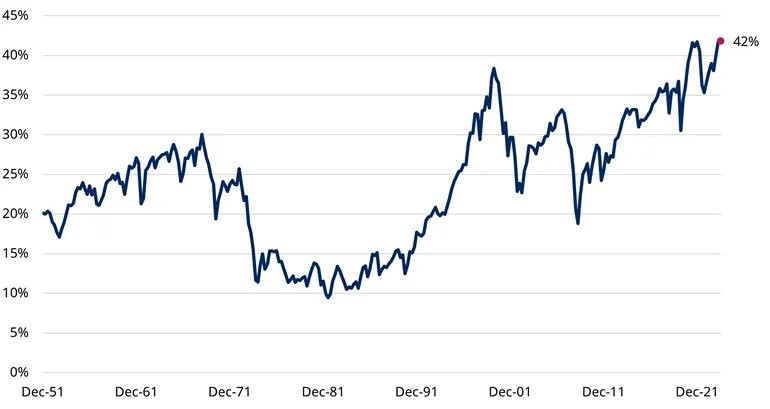
While sentiment towards non-US stocks is pretty downbeat compared with the US, some measures of sentiment towards US stocks are exuberant. The proportion of US consumers expecting stocks to move higher is at a 40-year high, and US households have never had so much of their assets invested in stocks.
Excessively positive sentiment is often a contrarian indicator (pride before a fall).
US households’ allocations to equities are also at record highs
Directly and indirectly held equities as a share of financial assets, households and non-profit organisations
Source: Federal Reserve, LSEG Datastream and Schroders. Data to Q2 2024.
A counter argument could be made that, with so much wealth tied up in the stock market, US policymakers may have a bias towards rescuing markets from a worst-case scenario, because of the economic knock-on effects. But this would only apply in a severe downside scenario.
5. Concentration in the US market has reached a record high
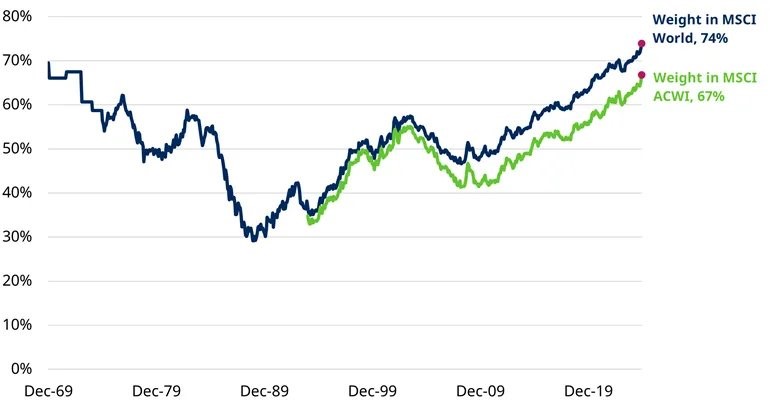
MSCI USA weight in major global benchmarks
Source: LSEG Datastream, MSCI and Schroders. Data to 30 November 2024.
Even if you are optimistic about the case for US equities, there comes a point when you have to question how much you are comfortable investing to back that view. At the end of November, the weight of the US in the MSCI World index of developed market stocks had risen to 74%. In the MSCI All Country World Index (ACWI) of developed and emerging market stocks, it stood at 67%.
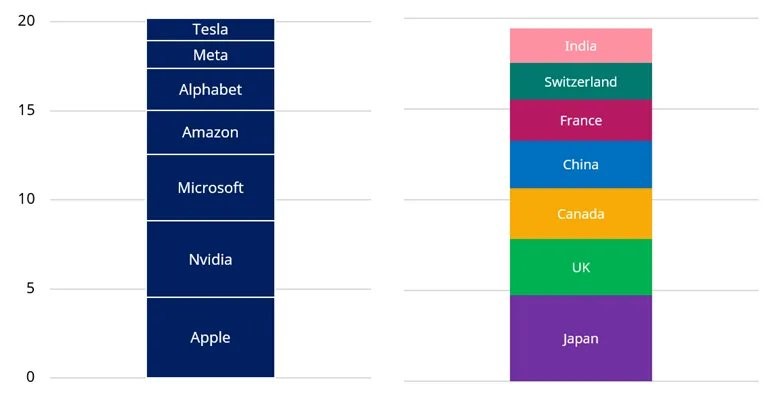
That is a lot of money in one country. What makes it more problematic is that the US itself is a very top-heavy market at present. The Magnificent-7 dominate. While investors might think that passively tracking the global market gives them diversified exposure to global companies, the reality is that these seven stocks make up a bigger weight in their portfolios than the next seven biggest countries combined.
Seven US companies make up a bigger weight in MSCI ACWI than the next seven biggest countries combined
Weight in MSCI ACWI, %
Data as at 30 November 2024. Source: LSEG Datastream, Schroders.
These seven stocks also make up the same weight as the 2,132 smallest companies in MSCI ACWI combined (out of a total of 2,650 constituents).
This much weight in so few stocks is worrying from a risk management perspective. It also means the wealth of investing opportunities offered around the world amount to barely a rounding error in the performance of the global market. My previous analysis has shown that, when market concentration has become extreme, investors have done better by breaking away from the confines of the index. Active approaches could prosper.
Adding some balance: the arguments in favour of investing in US stocks
One problem with the bearish narrative painted so far is that many of the same arguments could have been made, to varying degrees, at any point in the past few years. I have made some of them myself!
The US being expensive is not a new thing, nor is the relatively high weight of the US in global markets. The extent of these, yes, but we should be humble about using them to predict its downfall.
“Markets can remain irrational for longer than you can remain solvent” isn’t a popular saying among investors for nothing. The next section addresses reasons why investors could justifiably feel optimistic about the prospects for US stocks compared with international peers.
1. US productivity is soaring while the rest languish
Output per worker, rebased to 100 in 2008
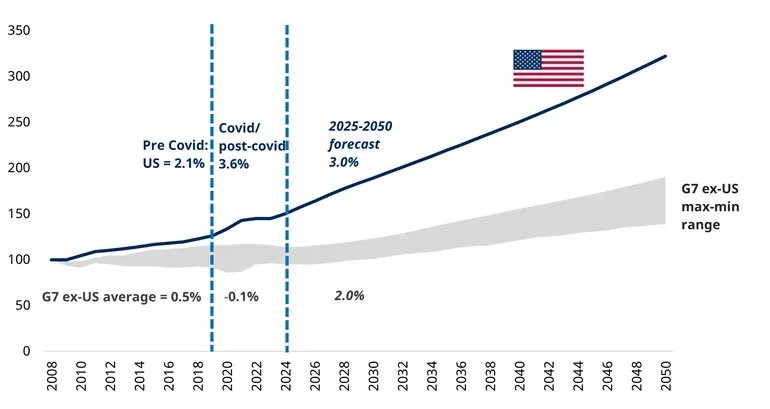
G7 covers Canada, France, Germany, Italy, Japan, the UK and the US. Source: LSEG Datastream, Oxford Economics, and Schroders. Data from 2024-2050 are forecasts.
The level of productivity is a key driver of economic growth.
US productivity growth soared ahead of the rest in the years following the Great Financial Crisis and then, when Covid hit, rather than falling back to the pack, it accelerated further ahead. This gap is forecast to continue. If these forecasts come true, US economic exceptionalism is set to endure.
2. The US also has more favourable demographic projections
The US working age population is forecast to increase while others shrink, supporting long-term US economic growth… but this hinges on immigration. A shift to a less accommodative stance on immigration could easily remove this advantage.

1950-2023 are estimates. 2024-2100 are forecasts, medium-variant and zero migration-variant. Source: UN World Population Prospects 2024 and Schroders.
3. Economic momentum is with the US
It’s not just long-term economic momentum which the US has in its favour, it is also performing better on a more cyclical level.
Economic 'surprises' have been more positive than in other regions and the Schroders Economics team have recently upgraded US growth expectations for 2025 and 2026 in response to President-elect Trump’s plans. We now expect 2.5% growth next year, compared with 2.1% previously. This compares with 1.2% for the Eurozone and 1.6% for the UK. Even stronger growth of 2.7% is forecast for 2027, comfortably ahead of other developed markets. For more details, see our latest Economic and Strategy Viewpoint.
This does come a cost, however, with higher inflation also forecast. This is likely to have consequences for interest rates and borrowing costs, ultimately posing a risk to growth. Although our central case is for strong US economic performance, in a downside scenario, higher inflation and rates could push the US in a stagflationary direction.
4. A buoyant US economy will benefit US stocks more than overseas ones
US large cap stocks generate around 60% of revenues from the US, other markets are less than half that. If the US economy does power ahead, US companies stand to be the main beneficiaries.
But US small caps and value stocks are even more highly geared to domestic growth than large caps. If that is your main reason for backing US stocks, there may be better ways to do so.
Geographic revenue exposure of major global stock markets:
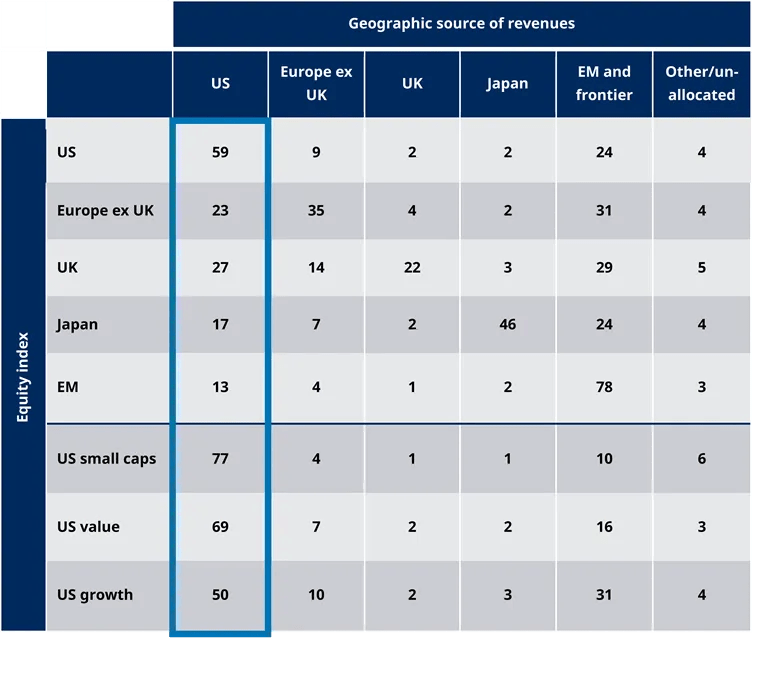
Other/unallocated includes Canada, Australia, New Zealand, Singapore. Analysis based on the most recently available data as at 19 November 2024. Note: the Russell 2500 index of US small and mid cap stocks has 76% revenue exposure to the US economy, a similar percentage as US small caps. Source: Factset, Schroders.
5. US companies are more profitable and are forecast to grow faster
Net profit margin, %
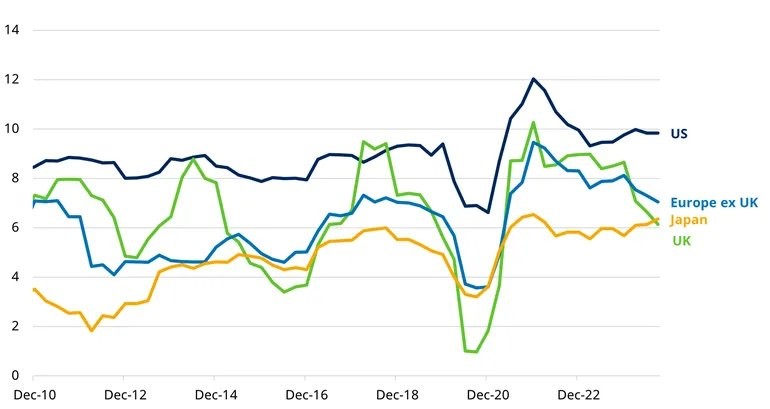
Based on Datastream total market equity indices for each region. Source: LSEG Datastream and Schroders. Quarterly data to Q3 2024.
Although one of the earlier arguments was that, outside of the Magnificent-7, European stocks hadn’t undershot US earnings growth by much, the reality is that, in aggregate, US companies have been consistently more profitable.
Whether this is down to sector mix or a handful of companies matters less when it comes to the earnings growth that investors benefit from when investing in the US market. Furthermore, US earnings growth is forecast to stay high through 2025 and 2026, comfortably ahead of the rest.
Corporate earnings: Consensus YoY EPS growth forecasts, %
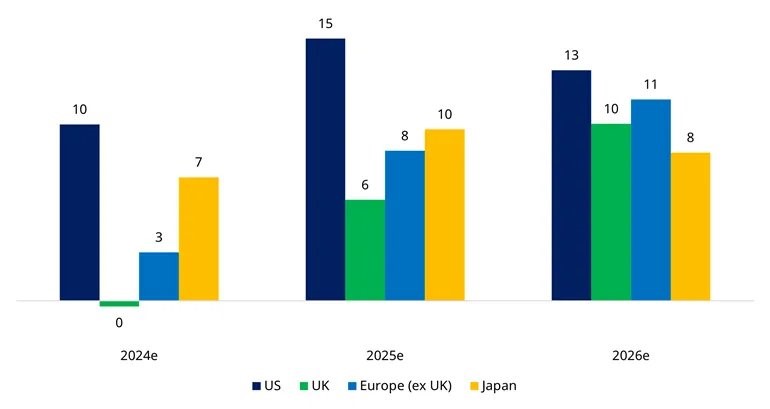
Note: Japan EPS is 4 quarter sum until 30 June of next calendar year, e.g. 2024 = 31/03/2024 – 31/03/2025. Source: LSEG Datastream and Schroders. Data as at 30 November 2024.
6. Prices are supported by high levels of corporate buying: demand > supply
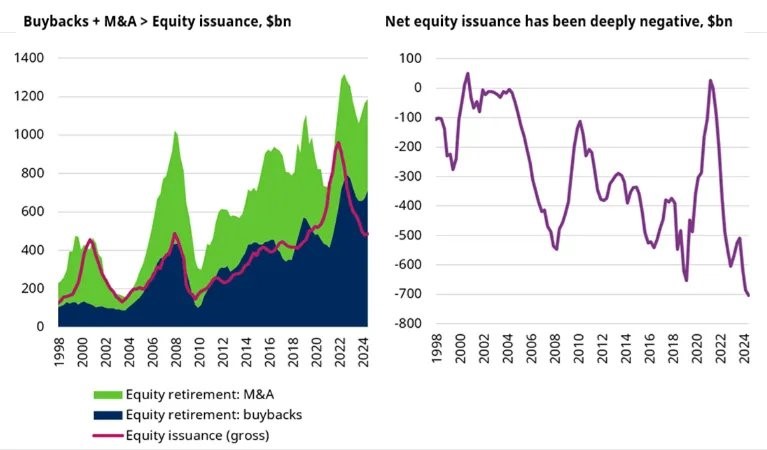
Data covers US-domiciled public and private non-financial companies. Equity issuance covers initial public offerings as well as equity issuance by existing companies. Net equity issuance = gross equity issuance - equity retirements (through buybacks and mergers and acquisitions (M&A)). Data to 30 June 2024. Source: Federal Reserve, Schroders.
Corporate buying, through share buybacks and mergers and acquisitions (M&A), provide a persistent source of demand for US stocks. This demand has exceeded the new supply of equities each year for the past 20, apart from 2021.
In summary
- US stocks are very expensive, some sentiment measures are bullish in the extreme, and you own an LOT of them
- This is problematic (and inflationary risks of Trump policies should not be discounted) but:
- US stocks also have a lot going for them
- other global markets have their own issues e.g. France, Germany, UK, China, Korea - hard to see a catalyst for acceleration vs the US.
- Consider diversifying to manage US risk rather than take a strongly negative view on the US:
- small and mid-caps, and value stocks, are cheaper and geared to US domestic strength
- international stocks are even cheaper and many individual companies outside the US are performing well
- active approaches within large caps can beef up exposure to (relatively cheaper) smaller companies within the large cap market
Duncan Lamont, CFA is Head of Strategic Research at Schroder Investment Management Australia. This material is general information only and does not take into account your objectives, financial situation or needs. Schroders does not give any warranty as to the accuracy, reliability or completeness of information which is contained in this material. Read the full report and important disclaimers here.
For more articles and papers from Schroders, click here.