Register For Our Mailing List

Register to receive our free weekly newsletter including editorials.

Home / 421

Three all-time best tables for every adviser and investor

I have read countless books on investing, met an enormous number of financial experts and fund managers, and made pretty much every investing mistake possible!

If I could distil my learnings into one statement, it would be this: the short term is unknowable, but the long term is inevitable.

Let me share my three all-time favourite tables from 30 years of investing.

The long term is inevitable

Firstly, the stock market has good years and bad, but over the long term there is only one trend and it is up. Despite this being obvious, I continue to be astounded at how investors behave during ‘bad’ years.

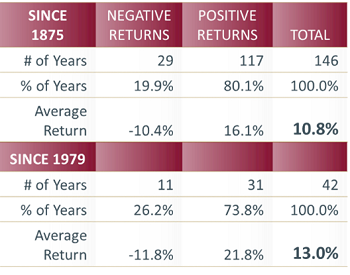
We are now into our 146th year on Australian stock exchanges (under various names). That enormous amount of data provides the clearest guide to anyone willing to learn. During this period, the market (dividends plus share prices) has risen 117 years and declined 29 years (returns used in this article are nominal, not real adjusted for inflation). So 80.1% of the time, the market rises. One in five years on average, the market declines.

Source: Katana Asset Management

When the market rises, it does so by an average of 16.1%, and when it declines the average is minus 10.4%. When combined, we see that over the past 146 years, the market has averaged a return of 10.8% per annum.

Since Australia has become more sophisticated and introduced the Accumulation Index in 1979, the data points to an even stronger outcome. Over the 42 years since 1979, the market has risen by an average of 13.0% per annum. And this is despite some seriously scary episodes, including the 1987 stockmarket crash, the 1997 Asian financial crisis, the GFC and the fastest crash on record, Covid-19.

If there is a better table than this, send it to me …

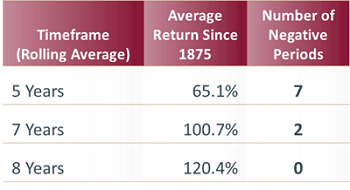
To better understand how the market behaves over different time frames, we can break the data into rolling periods. For example, a rolling five-year period, is the average return over every five-year period since 1875. 

What this table demonstrates is extraordinary.

Source: Katana Asset Management

If you were to invest your money in the ASX (index), turn off your screen, go away and comeback in five years’ time, then on average you would have a 65.1% return, and there would have been only seven occasions out of the 142 rolling five-year periods where you would have a negative return.

If you were to invest your money in the ASX (index), turn off your screen, go away and comeback in seven years’ time, then on average you would have a 100.7% return, and there would have been only two occasions where you would have a negative return.

But even more remarkably, if you were to invest your money in the ASX (index), turn off your screen, go away and comeback in eight years’ time, then on average you would have a 120.4% return, and there would have been NO occasions on record where the dividends and capital growth would have been negative.

There is only one long-term trend, and it is up.

Volatility is the price you pay for a seat at the table

But of course, in the short term – from year to year – markets are volatile.

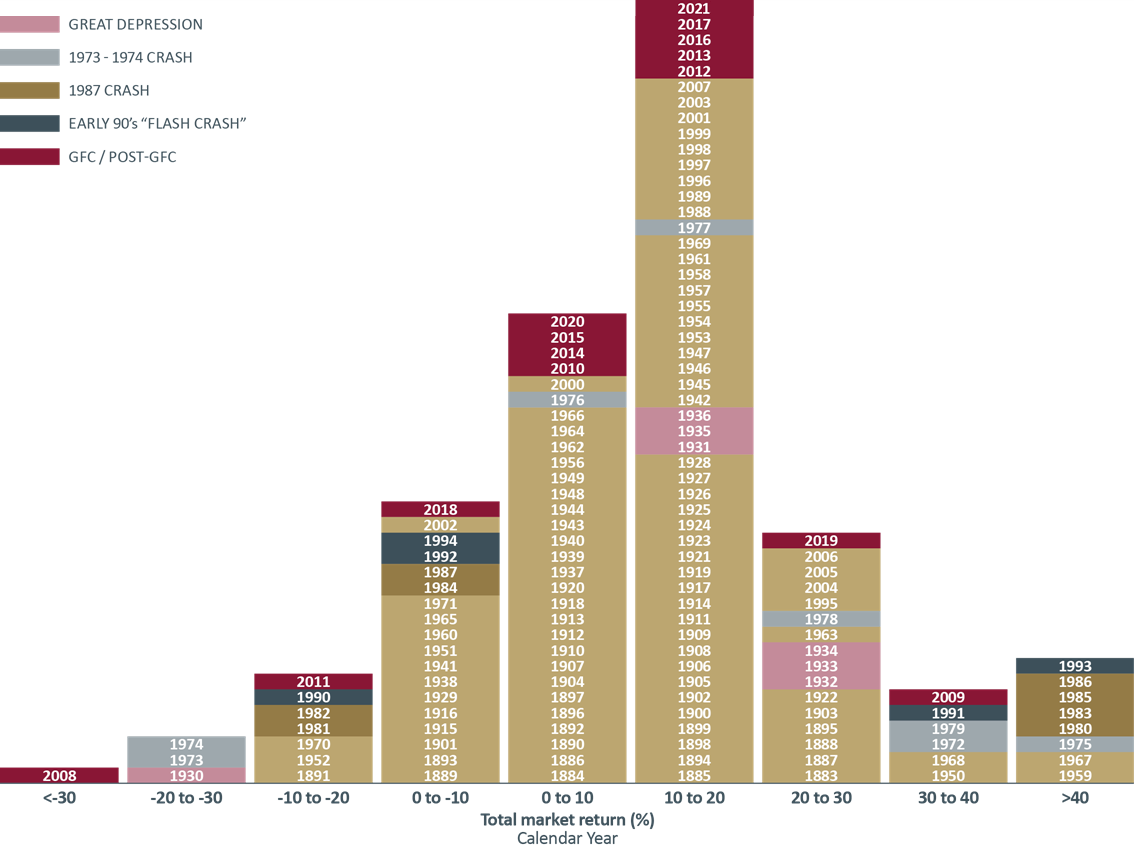
We’ve all seen this distribution curve below, but I suspect many investors have failed to grasp the most important aspect.
Source: Katana Asset Management (click image to enlarge)

Crashes are inevitable. Be ready and don’t panic at the bottom. In fact, the best time to panic is at the top.

Case in point. There has only been one (calendar) year in the 146-year history where the market fell by 30% or more, in 2008. But if you panicked and sold during that crash, you would have missed an extraordinary recovery. In 2009 the market was up by 39.6% and rose in 11 of the 13 years following the crash, including by 18.8% in 2012, 19.7% in 2013 and 24% in 2019.

Know thyself. If you are prone to doing the wrong thing at the wrong time, stay out of the stock market. Or work with a trusted financial adviser who can coach you through such periods.

Timeframe, timeframe, timeframe

If the short term is unknowable and the long term inevitable, an investor really does need to focus on the long term.

If through age or financial circumstance an investor does not have the luxury of a long-term horizon, then they should understand the extra risk that they are taking on. Remember in the stock market, volatility really is the price you pay for a seat at the table. There will be another crash. Guaranteed.

If your time horizon is not beyond the next crash, or you panic and do the wrong thing at the wrong time, then discretion may be the better part of valour.


Romano Sala Tenna is Portfolio Manager at Katana Asset Management. This article is general information and does not consider the circumstances of any individual. Any person considering acting on information in this article should take financial advice. 


48 Comments
Dave
August 29, 2021

Some observations to share:
It's not strictly and either/or proposition for me when investing. Passive investing is not strictly passive over time as the indices change over time. Active managers however can hold onto some core stocks even though they bounce around given indices over great lengths of time. Active investing isn't just about picking winners, it's largely about avoiding losers or for some, shorting losers. The small caps are full of losers which is why many small cap managers beat the index significantly and (over lengths of time) outperform (and underperform) the ASX 200. Timing is a significant, some say crucial part of any investing, whether backing an active &/or passive approach (see the Padley comments above).

I buy direct shares, mostly small and mid caps with some diverse large caps mainly based on value and dividend yield. The more growth oriented smaller caps I know I'm not good at identifying/monitoring I leave to my active LIC managers. I skew my investments to those with greater ESG values.

It's been my experience that, running my own portfolios (and watch lists for comparison) for over 20 years, is that this has worked for me well. At times, in downturns when I have bought some ETFs, I have later ended up selling them years later because they underperformed the rest of my portfolio.

They have great value though for those who are not willing to put in the time to watch their investments or don't care about the morality of certain companies in their portfolio. For me, I reject gambling companies and some irresponsible finance and mining companies.

Romano Sala Tenna
August 24, 2021

Hi James (reply 2, we'll need to leave it for now if this does not satisfy you).
The Bloomberg code for the index is ASA30. It is the ASX200 Accumulation index to capture capital growth plus dividends. It is the All Ordinaries Index (which captures capital growth) plus annual dividends (reinvested).

James
August 24, 2021

I refer to the Author's second graphic. With this in mind I decide to invest $10 000 into the ASX 200 in Jan 2010. The capital returns on the ASX200 from 2010- Dec 2019. (10yrs) are actually negative! However If dividends are reinvested, the total return was 4.9%. Well I've pick a point in time and rolled it twice - not even close to 65% return, and that's over 10yrs! I have checked my Morningstar data and had this checked on a Bloomberg terminal, 4.9% is the correct number. I keep thinking I am missing something. Would anyone mind double checking my numbers please?

Romano Sala Tenna
August 24, 2021

Thanks, James. My numbers are fine. Let me clarify:

First, even if your numbers are correct, 65% is an average, and that would include some periods of 200% and some of 4%. The return was positive as per the article.

Second, not sure where you numbers come from but let’s take the All Ordinaries Accumulation index as the simplest way to determine returns over this timeframe. XAOAI opened 33698.602 on 1/1/2010. Closed 31/12/19 at 71,813.874 = 113% return?

Third, the article refers to CALENDAR YEARS. IE we reference 146 years of data.

"We are now into our 146th year on the Australian Exchange. That enormous amount of data provides the clearest guide to anyone willing to learn. During this period, the market (dividends plus share prices) has risen 117 years and declined 29 years. "

Also, in the second extract below, if we were referencing by the month, then there would not be 142 rolling 5 year periods but 142 x12 = 1704 rolling 5 year periods. Whilst this may be a great exercise, we don’t have monthly data beyond the 1970’s, so this would not be possible.

"If you were to invest your money in the ASX (index), turn off your screen, go away and come back in 5 years’ time, then on average you would have a 65.1% return, and there would have been only 7 occasions out of the 142 rolling 5 year periods where you would have a negative return."

James
August 24, 2021

Thank you for you comment Romano, I am scratching my head, when has the Australian Index ever being at 33698.602 never mind 71 813.874? I referenced the ASX 200. What have you referenced? 

Tim
September 08, 2021

Looks like you might be calculating annualised return, not total return.

AXJO close Dec 2009 was 4569
AXJO close Dec 2019 was 7017

7017/4569 = 1.54 or 154%

https://au.finance.yahoo.com/quote/%5EAXJO/history?period1=1259625600&period2=1580428800&interval=1mo&filter=history&frequency=1mo&includeAdjustedClose=true

Allan
August 24, 2021

The decision of this webpage's moderator to not allow a number of comments to appear but places him/her as an 'extra' (read as: 'extractor') in the 'called-out' ca$t of actors appearing in the movie "A Few Good Men", who were told by Colonel Jessup: "You want the truth? You can't HANDLE the truth!"...but'll always strive to be 1st cab off the (p)rank to HANDLE other's money, keeping 'em in the dark an $teering* 'em away from many $agacious comment$.

*The hand that rock$ the cradle.

Graham Hand
August 24, 2021

Hi Allan, yes, we moderate comments by either editing or not posting if we don't deem them suitable. This is standard industry practice and if this is considered censoring, fine.

Steve
August 21, 2021

I have one misgiving/complaint about articles that use total return (capital gain + dividends). I agree that long term shares are a great investment, but in the case particularly of Australia where dividends are a higher proportion of total returns a split between dividends and income is needed particularly where retirees are prone to spend the dividends and hence need the for capital to stand on its own feet. I have made a comment to Morningstar in the past on the folly (my view) of an "income" portfolio where the basis is reinvestment of dividends (if I reinvest I have no income.....).
So, how does the argument hold up (re number of years with no capital losses) if we assume dividends are spent to fund retirement and not reinvested? Further, what is the impact on capital if a fixed level of money is taken each year (say 4% or 5%). This might start to approach a real world post-retirement situation.

Anyone can grow assets if they never spend anything, but that only covers the accumulation phase. What about the retirement phase?

alistair
August 21, 2021

so you need basically 5 years of cash to spend, so that no withdrwals occur. so say 3,000,000 total, 750,000 to fund 5 years (150,000, 5%), will result in 3,712,000 at the end of the 5 years with 65% return. That the principle of Don Ezra's article. That assumes crash in first year.

Kevin
August 21, 2021

The theory is very simple.The practice is impossible,people will not do it.
From my contract notes on my concentrated portfolio.Take a 40 year view,the whole of this century basically and super hitting 9% in 2000.
ANZ bought @ $9.54 on 23/1/98. $20K to buy 2000 of them.Use the DRP and by 2040 you'll have 16,000 shares in ANZ,perhaps a few more .
I put up WBC a good few years ago now to compare it to Super,I thought I paid $12 for them after a pull back from $15. Bought WBC $12.90 each on 4/5/2001.2000 of them cost you $26K.Same deal 16000 shares approx by 2040.
On 30/6/2040 or 31/12/2040 you'll know the price of both companies.
ANZ 16,000 X ?
WBC 16,000 X ?
Your total outlay is $46K. There is the accumulation,I think both companies will still be there in 2040.
From 2040 on you are living off dividends and your super.
To model it then you retired in 2015 ( or 16).Top of the market for bank shares,both @ $40 each approx.You are living off dividends and your super from then on .16,000 shares in each of them at that date,you retired with $1.28 million and your super.
The rest of your life is watching and living off the dividends.Don't look at the capital,you'll worry yourself into an early grave .Your super will slowly run down and hopefully the increase in dividends will pick that up.
Reality is reality,you die in 2030,leaving 16,000 shares in each of those companies to your family or charity.
The theory is simple, give Romano $50K tomorrow,turn your back on him,see you in 30 years mate,don't let me down.
Romano does well,he gets you 12% average for the coming 30 years.
You meet up with Romano,how did we go mate.I've got you $3.2 million says Romano,12% compounding for 30 years .You think he is the greatest person ever born,don't even think about the fees he took from you,it was worth it ,exactly as he said.

Kevin
August 21, 2021

Sorry,I wasn't concentrating,I doubled it 6 times instead of 5.Romano got you $1.6 million

Ramon Vasquez
August 21, 2021

Hello .
lt would seem to me that the Marcus Padley approach would seem to be the best , namely , to think of a portfolio itself as a single stock , and then sell / buy back , as appropriate , at the market major turn - arounds .


I am not certain that MP would agree with my interpretation of his method . However l think that such a method suggested would support the use of a concentrated portfolio consisting of the biggest names in the market per the named " Idiot's Portfolio " by MP .

All the best , Ramon .

Allan
August 19, 2021

Allow me to 'mark your card'. Investing in the stock market is no different to when a guy sits down to play poker with $tranger$. If within the first few minutes of the game having begun he hasn't worked out who the 'patsy' is...then he's the 'patsy'. Keep your cards close to your che$t.

I fundly..err..fondly remember reading a guy's sic_cinct..err..succinct comment on Marcus Padley's webpage years ago, where he wrote: "I have a self managed catastrafy (sic)"...so I replied wit(h): "I had one of those too but the weal fell off it!"

SMSF Trustee
August 19, 2021

Allan, what nonsense.
Since when is buying into an asset class that goes up by an average of 11% or more a year, with some negative periods but mostly positive, anything like playing poker?
You can lose everything in poker, but when was the last time someone who bought a share portfolio and hung onto it for many years like you're supposed to do lost everything? Or when was the last time the All Ords fell to zero?
Exactly.
Sure, you can use the stock market to gamble for short term gain, but the message of this article is don't do that. Shame on you if you used a tax privileged vehicle like an SMSF to punt like that. But the disastrous result is your own stupid fault, not the intrinsic character of the stock market.

Allan
August 20, 2021

SMSF Trustee...Come in spinner! Sometimes it's best you remain quiet and try to abstract thought occasionally if you can; it doesn't hurt, because you have focused on the mention of 'poker' per se which has risibly caused you to completely miss the point. But then, some mothers do 'ave 'em. The way you misinterpret things like your wont of holding on to shares for a long time as if doing so is a pecuniary panacea reminds me of Vladimir and Estragon in 'Waiting for Godot' where - given they had both already waited for eons - one them eventually says to the other: "C'mon, let's go, he's not coming!" And the other one in a mad panic (like someone who's held onto some shares for far too long and hopes like hell there's a bigger 'patsy' than him just *waiting* (for Godot?) to be 'had' and who's not stoically-standing in the mile-long queue of folk outside the bank.), quickly says: "No!, no!...if we go now, we'll undo all the good work we've done thus far...!!!" Yeah, right! You ask: "...but when was the last time someone who bought a share portfolio and hung onto it for many years like you're supposed to lost everything?" Bernie Madoff long-held onto a share portfolio and lost the whole bang lot, and such was his lot in getting banged up for life to boot. QED

SMSF Trustee
August 20, 2021

Allan cooking yourself in your own juices there. Don't worry, I won't get sucked into reading your nonsense any more let alone replying.

Greg
August 23, 2021

Drinking your own bath water I suspect Alan…

John
August 20, 2021

The essential difference between gambling and investing is the expected return.

By expected return, I don't mean what you hope for, as every gambler knows what he expects to to make a fortune, but in reality the expected return from gambling is always a negative - take lotto for example, place your bet, and continue to do that over the long term, and you can expect that your outcome will be about 80 cents for every dollar you invest (some will do better and win the million on the first bet), but the expected return is negative. Even playing poker with your friends, the expected return (average of everyone at the table) is for every dollar you bet, you get a dollar back - zero return. In the casino, you can be sure that even poker has an expected negative return.

Investing however your expected return is positive (over the long term)

So there is a world of difference between the stock market and playing poker. Of course, putting money in the stock market into a single stock is getting close to gambling, but a well diversified investment in the stock market is nothing like playing poker.

Allan
August 20, 2021

Hi John...you say: "[...] ...but in reality the expected return from gambling is always a negative - ... [...]". Not if one gambles using the 'Martingale system' but (n.b.) with certain moral* manipulations that are known only to a select few, which is just like there are many more folk who don't know anything at all about the 'Mandrake Mechanism' (to be found at "The Creature from Jekyll Island") than the very few who not only know everything about "it" but actually use "it", and largely-lucratively to their very own de_vice (sic). *(Gamb)it's a 'moral' to win with Martingale when one ensure$, that with it won..err..one always has the 'in$ide run', making it the normal run of event$. Rather than your just blindingly 'lending' your money to the bourse for any length of time by purchasing shares etc., try instead to just (b)lend-in where you won't ever be 'noticed'...'noticed' being like when one is 'notified' via a margin call from your (b)lender demanding more of your cash.

Geoff
August 20, 2021

You seemed to be focused on what you imagine to be clever wordplay, rather than actually having anything of interest to say. Or if you did, you're too subtle for me.

Anne
August 23, 2021

Absolutely ... Incoherent comment.

Kevin
August 19, 2021

I agree 100% Romano. Time is money,I think 30 years is short term investing.A small difference in returns over that period makes a big difference.
AXJOA gives the long term compounding,last time I looked it was around $85K,for an outlay of $1K on 1/1/1980,minus costs of course.A rough idea of time is money.
I have a very concentrated portfolio,3 companies have stood out.CBA,WES and MQB,now MQG,these have been held for many many years,and dividends reinvested until the time came to live off dividends.Sometimes it has been a tough ride,they all had 5 or 6 year periods of dividend returns only basically. CBA is the last slow burner,a peak of $96 in 2015 or 2016, then nothing until suddenly,now @$100.However I bought CBA in the original float and have just kept adding when the price has dropped by 20- 30%,or in capital raisings.The $26 or $27 raising they made a mess of during the GFC,the pressure that created,thankfully I have wiped it from my memory,but sometimes I wonder how I survived.WES with their 2 raisings at $28 ( I bought that one) and $14,I had nothing left for that one so missed it.
MQB (G),nothing for probably 8- 10 years from purchase in 2005 (6?).Watching it go from $90 I think down to $18.Flatline until 2014 or 15.Now at $160 ish,how easy is this game ( says me wondering if I am mad or have a rough idea of what I am doing,stick for the long term).

WES at the AGM in 2015 I think.Coles looked as if it hadn't worked out,flatline from around Nov 2007 until that AGM.Very restless shareholders.A chart was put up,from listing in 1983 or 1984 ish a $1K investment had grown to over $300K,taking up rights issues and using the DRP,gobsmacked shareholders.Put your trust in us for the long term.Coles floated out at 1 for 1 and combined the share price now around $83.
Thanks again for the history lesson,I knew most of it but it is always good to have the memory refreshed.

Well done for the outperformance.We all have the choice of doing it for ourselves,or putting trust in somebody else.We all have to trust somebody like yourself,or the board of directors of the companies we choose.We only have history to guide us.

Allan
August 20, 2021

Sometimes I wonder about Mrs Einstein's young lad Albert and the level of his nous at being able to 'nut' things out, because he said that one of the things that really amazed him, was 'compounding interest'. Surely such a simple thing as 'this' - given the fact that 'from little things big things grow' - should not have attracted such interest from him? Go figure.

'Trust' is a word that is bandied about like there's no tomorrow. We are told to trust the police et al., but there's no need to trust them. Just give them, like anyone else, a job to do (like if you've been burgled or scammed etc.) and see that they do it to your satisfaction. Trusting anyone is but a 'risky' business. Don't be one of those persons who are (t)rusted-on 'trusters'. Scale your (t)rust right back.

The word 'safer' is also bandied about and is a veritable nonsense, because you cannot make something 'safer' (like 'travel by air'). To make it 'safer', it would've first had to have been 'safe', and if so, then you cannot improve upon its level of safety. If a woman is already pregnant, she can't be made pregnanter. It's safe to say that 'safer' is a nonsense.

Travel by submarine has always been far less dangerous than by air simply because there's far more aircraft under the oceans than submarines in the sky. Invest in submarines by all means if that's what floats your boat but be careful where you sink your money.

For those interested, have a read of 'Survivorship bias' on wiki, paying particular attention to the bit about "In the military" and *damage done to aircraft* during WWII and where things vitally needed to be *beefed up*. We tend to cover..err..covet only that which we see, which isn't a *patch* on that which we don't. QED

Joe
August 18, 2021

Although I agree in principle to the long term approach to investing, the article seems to concentrate entirely on diversified growth assets, whereas Fred makes a valid point about compound interest from DRP's which are more or less concentrated on income, dividend paying stocks. After all retirees who rely on dividend payments with franking credits and also register for DRP's when applicable, can get the best of both worlds because they can receive franking credits as a part tax offset, (depending upon their taxable income ofcourse), as well as income growth from increased stocks being held.

John
August 18, 2021

The article claims that there are 146 years of data, and that of those years only 7 five year periods have produced a negative return.
There are in fact about 51,500 5 year periods over these years. One would have ended on 30 June, 1875, another would have ended on 1 July, 1875, and so on, so that the 51,500th 5 year period would have ended on 30 June, 2021 (I may have got the numbers wrong, but I hope you get my drift)
As very few investors invest on 1 July and withdraw 5 years later, a more interesting statistic would be what proportion of those 51,500 (1826 day periods - ie 365.25 multiplied by 5) would have produced positive and what proportion negative returns - and similarly for 2557 and 2992 day periods (7 and 8 years respectively). And another interesting statistic would be what is the 95% range and the 99% range of each of those periods

John
August 21, 2021

Never let the truth screw the point you are making...

Allan
August 22, 2021

Beware of those who - when you're making a point - say to you: "I take your point!", because, true to their word, take it they will, and then you'll need to make another one (just like the Fed having to keep printing more money!) which they'll also take, and before you know it, what you're trying to do will soon but become pointless.  Many politicians, now well aware that Covid will be around for a long time, are gleefully rubbing their hands together because they collectively act on the premise that a fearful populace keeps governments in power.

Romano Sala Tenna
August 18, 2021

Passive investing is good for investors with limited time or lacking professional advice. However a couple of % extra net of fees over time has a significant impact due to the power of compounding.
Note that John C. Bogle was NOT AGAINST ACTIVE INVESTING - he held active funds personally. What he was against was high fees. So if a manager is out-performing the index NET OF FEES by >2% over a long period, then why would you not consider them?

Michal
August 21, 2021

Investors with ‘limited’ time are called savers.
Honest professional advice is focused on long term planning and variables which can be fully controlled (rather than fund management).
Vast majority of active fund managers regularly underperform the index (refer to annual SPIVA report). This suggest that the 2% net outperformance is lovely in theory, but cannot be consistently achieved over long term. Hence, the passive approach is often preferred.

Romano Sala Tenna
August 18, 2021

This article is not a case for passive vs active - Katana is an active manager! This article makes the case for understanding that volatility is an inherent part of the stock market, that another crash is guaranteed, but that raising your eyes to an appropriate timeframe is the key to long term wealth accumulation.
On the passive versus active front, the key is genuine and sustained out-performance. Small out-performance COMPOUNDED over time can have a very large impact. For example, Katana has out-performed the All Ords Accumulation index net of fees by 2.60% per annum since inception in 2006. That may not seem like a lot, but when compounded over that timeframe, it is the difference between a 208% return on the Accum Index versus 347% for Katana. That is the case for (good) active managers.

Robin Ford
August 18, 2021

John C Bogle covered this theme pretty well in The Little Book of Common Sense Investing. As I recall, pretty well all active managers suffer "reversion to the mean" over longer time frames which equals market return minus fees and other charges.
I am very comfortable sticking with my holdings of VAS and VGS.

Davo
August 18, 2021

I appreciate this in not a debate about passive versus active, however I can recommend a book by Charles D. Ellis, "Winning the Loser's Game: Timeless Strategies for Successful Investing". Basic argument is that since 90% of trading is now done by institutional investors (i.e. the active fundies) ther ARE the market and so will very rarely beat it. Throw in their fees and index funds will nearly always outperform over the long term.

Rylet
August 18, 2021

Two case studies supporting active: See Mirrabooka. Plus MFF - TSR and NTA annualised return over the past 10 years both 18.3% MSCI Global ex-AUS (AUD) - annualised return for 10 years 16.4%

Rylet
August 18, 2021

There are many fund managers who can show long-term outperformance, especially in small andmid caps.

Geoff Jowett
August 18, 2021

While the figure as presented are impressive I'd suggest they are flawed. Considering index EFTs, and other all index products have only been available in recent years, to obtain the quoted figures an investor would have needed to have held all listed shares in the same proportions as their index weighting for the entire time the shares are listed for the full 146 years!
It is still a stock pickers game.
Also I appreciate Romano is only analysing the Australian, but whenever I hear the comment "the market always goes up" I refer the person to the Japanese market which as we know is only trading at half what it was 40 years ago.

Fred
August 18, 2021

Do the % returns include re-investing the dividends as this can make a significant difference to the overall compunded return after a number of years?
If so, is there similar data based on share prices alone?
The compunding is particularly significant for retirees as dividends often have to be taken for retirement income.

Rich Uncle Pennybags
August 18, 2021

Excellent reminder to take the long term view.

John De Ravin
August 18, 2021

Thanks a lot Romano! I was trying to make exactly the same point about timeframe to some newbie investors a few days ago and had to make some assumptions, it would have been better to use actual past Australian data. Thank you.

Mart
August 18, 2021

Wow ! OK, I'll bite .... if you agree that investing is a long term game then why would you use an active manager / trader approach given this evidence ?

INCOMING !!!

Russell (a veteran adviser)
August 18, 2021

and, yet, having created a world of passive ETF's, the trend is to active ETFs.

Graham Hand
August 18, 2021

Hi Russell, active ETFs gain the headlines because they are a fresh initiative promoted by active managers, and they are certainly an important development. But 90% of ETF flow still goes into 'passive' (including smart beta) so it's a slow trend. Plus the conversion of Magellan from a LIC to an active ETF was a one-off boost to the 'trend'.

Mart
August 18, 2021

Graham - can I be cheeky and make a request please? In the next edition of Firstlinks can you find someone to pen 'the case for the defence' ?! I do understand that the evidence presented in this article is based on (very) long term investing / holding, but it would be really interesting to hear the counter argument from those who promote active / trading approaches (and backed up with statistics / charts from them as clear and compelling as those Romano has shown).

It seems to me Romano's "evidence" strongly backs up the approach and 'mothership chart' that Peter Thornhill presents (I won't rehash Peter's stuff here as there are several of his articles that can be found within your 'contributors' section). It also aligns with Buffet's advice that most investors would do best by picking and sticking with an index fund of US stocks. Being unkind, you could say that aligns pretty closely with a 'set and forget' approach (with dividend reinvestment) ... I think Peter calls it 'benign neglect' !

Given the above, it would be great to hear the opposing views / approaches to building wealth ! I'll be very unfair and single out Marcus Padley as someone who'd be great at putting that view (if nothing else it would be entertaining !). Amongst his statements that stick in the mind are that you are an idiot if you believe you haven't made a loss by not selling (the direct opposite to Romano's thesis!), and you need to ensure that your Super fund has a 'turn everything to cash' button for when the market crashes ! I have to say I personally really enjoy his writing, and always get something out of his articles, and it would be really interesting to see him address this specific article. Again, a bit unfair on Marcus as he's the one that comes to mind for me and I'm sure there are many others that could pen a counter argument, but I'm sure whoever does it would provide for a fascinating read

Thanks ! Mart

Jaxx
August 22, 2021

Graham is correct. In reality the Active ETFs are really just flashy and hyped up ... Come one come all. You just can't loose. Just like the gambler comments of the OP above.

Aleks
August 18, 2021

Because people are impatient

Phil
August 18, 2021

The defence in theory is pretty easy Mart, the practical implementation much harder! The rolling return chart showing 0% negative return period over 8 years is correct. But it doesn't tell you what the actual return for those periods were.
So the defence argument would isolate one or more of those 8 year periods where the actual return achieved may have been say 1% therefore defeating the Nil negative period thesis. Than compare that same period to say an investment in bonds for that period and you would have been better off for example. The trick or problem is knowing which 8 year period to be defensive or more defensive than 100% Equities. Any form of defence would need to provide some evidence that this form of asset class timing can be done consistently and successfully, and that evidence is more nuanced with arguments both sides and they've been going on for a hundred years! Of course, if drawdowns to fund portfolio liabilities are required, the maths change again. Hence you must come back to , how much risk can I tolerate, how long can I stay in my seat without having to sell, how long is the time horizon of the goal of why I'm investing - the intersection of these things will help you set a strategy, not trying to prove theorems - but I agree it's fun reading and trying!!

Mart
August 18, 2021

Phil - I agree 100% ! The issue, as always, is are you comparing apples to apples. I suspect the only way we'll settle this (!) is to do similar to the Buffet charity bet in 2007 ($1m usd I think) that an US index fund would outperform a hedge fund manager in the following 10 year period. One hedge fund took him on and lost out (but some margin too I recall). So maybe we set Romano against someone 'active' and come back in 10, 20, 30 years for the 'answer' ?!

Phil
August 18, 2021

Haha well yes, but I'm not putting up the $1M!!


Leave a Comment:


RELATED ARTICLES

4 ASX small caps poised for a big year

Four all-time best charts for every adviser and investor

The tortoise wins in investing

banner

Sponsors

© 2024 Morningstar, Inc. All rights reserved.

Disclaimer
The data, research and opinions provided here are for information purposes; are not an offer to buy or sell a security; and are not warranted to be correct, complete or accurate. Morningstar, its affiliates, and third-party content providers are not responsible for any investment decisions, damages or losses resulting from, or related to, the data and analyses or their use. To the extent any content is general advice, it has been prepared for clients of Morningstar Australasia Pty Ltd (ABN: 95 090 665 544, AFSL: 240892), without reference to your financial objectives, situation or needs. For more information refer to our Financial Services Guide. You should consider the advice in light of these matters and if applicable, the relevant Product Disclosure Statement before making any decision to invest. Past performance does not necessarily indicate a financial product’s future performance. To obtain advice tailored to your situation, contact a professional financial adviser. Articles are current as at date of publication.
This website contains information and opinions provided by third parties. Inclusion of this information does not necessarily represent Morningstar’s positions, strategies or opinions and should not be considered an endorsement by Morningstar.