The largest companies in the U.S. have seen marked improvement in their profitability on a number of measures over the last 30 or so years, while smaller companies have seen little change. The improvement for the largest companies is probably due to increasing market power and a playing field that has tilted in their favour.
It is my guess that the field may tilt back away from them in a way that will hurt their profitability in the future. But the safer bet is that the process will be slow and uncertain. Given that our valuation models assume margins revert relatively quickly, we may well be a little too tough on these companies, but even giving them the full benefit of the doubt on their future profitability would still leave them looking expensive versus the rest of the world.
The last decade of global equity performance
If you will accept a little oversimplification, the last decade or so of global equity market performance can be summarised as follows. U.S. stocks have profoundly outperformed stocks in the rest of the world, whether other developed markets or emerging markets. This outperformance has been partially driven by U.S. P/E ratios expanding more than in other markets. But the largest driver of the outperformance has been the massive superiority of earnings growth in the U.S. relative to anywhere else. This superior earnings growth has been driven not so much by strong top-line growth, but by expanding profitability by U.S. companies relative to sales, gross profits, or other measures that can plausibly be used as proxies for economic capital.
Unlike in past cycles, this rising profitability seems to have been neither a result of, nor a driver of, increased corporate investment. The improvement in profitability has occurred only in the largest companies. These companies have been out-earning their smaller brethren by increasing margins over the past 25 years or so. The long period of their improvement suggests this effect is not something we should expect to correct over a single business cycle, but my guess is that the world in the future will be less favourable to these large, dominant companies.
For a long time, U.S. corporate profits seemed to be an exceptionally well-behaved. Exhibit 1 shows corporate profits relative to GDP in the U.S. since 1929, with dotted lines marking the average level across the 20th century and the period 2004 to 2019.
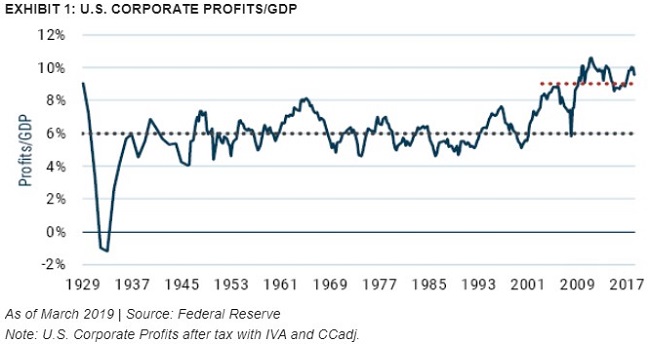
Up through the 2001 recession, this series was remarkably mean-reverting, with the expected fluctuations across the business cycle and the only outlier occurring in the depths of the Great Depression. Sometime around 2004, however, this series experienced a decided upward shift and since then has averaged 9% of GDP versus the 6% average for the 20th century. Though it has maintained its cyclical variations, the series seems very clearly to have been varying around a different mean.
This shift, as profound as it seems to have been, has not actually been that widespread among companies. Exhibit 2 shows a conceptually similar series, profits as percent of value-added for corporations. It isn’t exactly the same as profits/GDP, but it is available on an individual company basis.
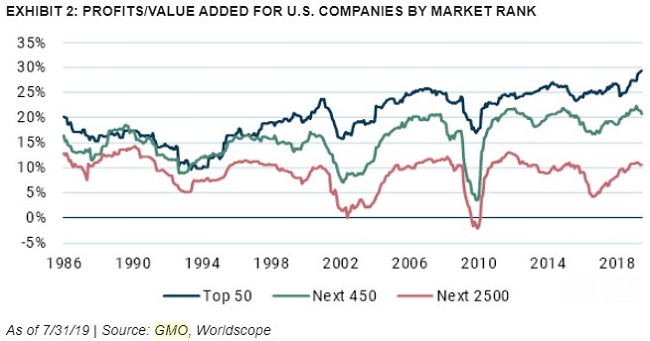
Exhibit 2 shows that the increase in profitability has not been evenly distributed. With the number of lines on the chart, however, it’s probably easier to understand the magnitudes in table form.
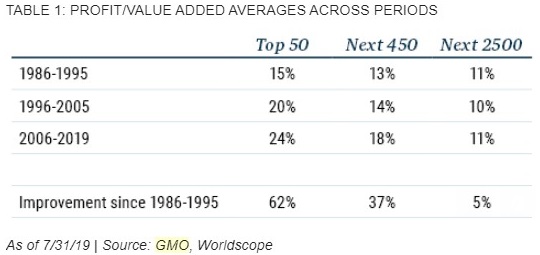
The top 50 companies really started to distance themselves from the pack by the late 1990s and today have opened a huge gap on the rest of the listed universe. Smaller companies, by contrast, have seen little or no change over the period, which leaves the large majority of public corporations in the U.S. enjoying no benefit from the greatest advance in overall corporate profitability in U.S. history!
The impact of business investment on profit
Until the early 2000s, there used to be a meaningful relationship between profits and investment – high profits were associated with high rates of investment and low profits the opposite. The correlation between them was about 35%. But just at the time that the profit series made its lurch upward, net business investment made a lurch downward, from which it has not recovered.
On the face of it, this is extremely odd. If profitability is high, corporations should naturally respond by increasing investment. While in principle this tendency could be stopped by there being a particularly high cost of capital, it is pretty obvious this has not been the case over this period. You certainly couldn’t describe the period since the early 2000s as being a high-cost environment for raising equity.
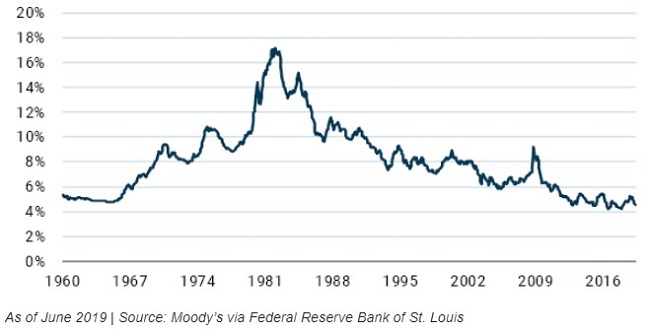
It has also not been an expensive time to raise capital through borrowing. Exhibit 3 shows the yield of Baa corporate debt, which again has been conspicuously low in this period.
EXHIBIT 3: BAA CORPORATE BOND YIELD
Why would we have a combination of enhanced profitability and decreasing investment? The most plausible answer seems to me to be that increased industry concentration and market power by the largest companies means the bulk of their profits takes the form of economic rents in the businesses in which they are dominant. Because the firms are already dominant in their spaces, there may not be a lot of expanding they can do short of branching out into new business lines, where their position will likely not be as dominant and their profit margins far less enticing.
The investment opportunities of these extraordinary companies do not seem to have grown on pace with the economic rents they are capturing in their current business. And the rest of corporate America is not profitable enough to justify ramping up its investment.
What does that tell us about the future of growth and profits in America? The plus side of low rates of investment is that it means less chance of overcapacity, which pushes down profit margins, being created. The minus side is, of course, slow growth. While it is probably unfair to entirely blame the slowdown in U.S. productivity growth on the fall-off in corporate investment, the period since 2005 has been a uniquely dismal one for productivity growth in the U.S.
What does this tell us about their future prospects?
It’s hard to look back at history to determine how we expect the future should evolve for them. The trend has certainly been in their favour and absent any change in the environment it is tempting to assume things will continue to get better for them.
There are a couple of potential flaws in that reasoning. No company’s competitive position is safe forever. Today’s champions have certainly done well historically, but the history of dominant companies shows that their extraordinary profitability tends to decay over time. That decay may be slow or rapid depending on the company.
For the most stable dominant companies, such as the ones favoured by our Focused Equity team in the GMO Quality Strategy, history suggests that their profitability decays to normal over something like a 30-year period. Now, 30 years is a long time to benefit from above-average profitability, justifying a significant valuation premium over average companies. But from the standpoint of forecasting the future profitability for such companies, it argues for a slow reversion rate for profitability, not no reversion.
The question is really whether the environment that has favoured these dominant firms is likely to remain so biased in their favour. My guess is that it is not. The recent announcement of anti-trust investigations against the largest technology and related communications firms seems unlikely to be a one-off. Apart from the simple issue of their growing dominance and staggering profits, the negative societal and privacy impacts of their basic business models make it harder to paint them as plucky upstarts improving the world and easier for critics to characterise them as disturbing big brother entities feeding off the worst instincts of humanity. Health care companies face a similarly daunting level of unpopularity, driven by their pricing practices combined with the striking disconnect between the amount the U.S. spends on health care versus the rest of the world and the health outcomes that spending seems to deliver. The growing interest in academia and beyond in studying the deleterious effects of large firms beyond looking at the direct impact on consumer prices also suggests a broader push against dominant firms on principle is increasingly likely.
If we took the stance that the next seven years would see a one-third reversion of the trend of large company margins back to their long-term average, our forecast for the S&P 500 would improve by 1.4%. Given that our current forecast for that group is -3.8% and -0.9% on our two base scenarios, that assumption would raise the forecast to -2.4% and +0.5%. That is enough to shrink the U.S. ‘margin of inferiority’ relative to other equities, but still leaves it at the bottom of the equity barrel.
Exhibit 4 shows the forecast for the S&P 500 with and without the potential changes relative to some of our favourite equity assets.
EXHIBIT 4: S&P 500 VS. OTHER EQUITY GROUPS
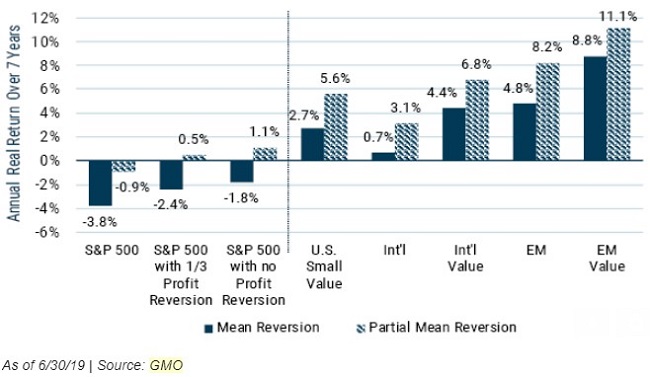
The groups we are excited about within global equities – U.S. small value, international developed value, and, above all, emerging markets value – are all at least at a 4.5% higher forecast return in the friendliest version of the forecast for the S&P 500, with EM value a stunning 10% to 10.6% higher.
For the moment, we are not making any changes to our ‘official’ asset class forecasts despite a guess that we are being a little tough on the U.S. mega caps. Our preference is to not make one-off adjustments to our forecasts but look for the broader principle behind an issue and find a way to systematically build it into our models.
Ben Inker is Head of Asset Allocation at GMO. This article is general information and not financial or investment advice, and it does not consider the circumstances of any investor.
To read GMO's full 2Q 2019 Quarterly letter, click here.