For many Australian investors, the preferred equity allocation is up to 50% in local shares, a large allocation to Developed Markets (DM) equities and a much smaller position in Emerging Market (EM) shares.
That global equity allocation gives Australian investors access to more economic growth and attractive sector returns (e.g. from high performing areas like technology). It also offers the upside of the widest possible security selection – the chance, simply put, to own the world’s best, most attractively-priced companies.
In this article we look at Australian investors’ EM allocation. Allocating some funds to EM has a number of potential benefits.1
- It offers effective diversification – between 2015-2024, the correlation between Emerging and Developed markets was just 0.462 SCI – MSCI World and MSCI Emerging
- EM economies are forecast to grow faster. According to January's World Economic Outlook from the IMF, they will grow at 4.3% in 2025-26. DM markets will grow at half that rate (1.9%).
- EM markets reward stock-picking. In Developed Markets there’s an average of 11 analysts covering individual stocks worth over USD1 billion. In EMs there’s only seven analysts for each of those companies. That potentially gives fund managers more space to exploit mispricings.3
The key question – what’s the best way to invest in EM?
At Platinum, we’ve been asking ourselves whether Australian investors are getting maximum benefit from EM investing. We believe there’s a better, more efficient way to add EM diversification – and EM-style returns – to portfolios. Our conclusion is that Australian investors may achieve better outcomes if they invest in Asian shares rather than EM share funds.
Let’s look at what you get from a typical EM investment.
Some 80% of the MSCI Emerging Markets Index – both by market value and number of companies – is in Asian securities. The main non-Asian countries in the EM index are Brazil, South Africa, Saudi Arabia, Mexico and UAE. Those 5 countries account for 75% of the non-Asia component of the MSCI EM Index.
Figure 1. Where EM money goes
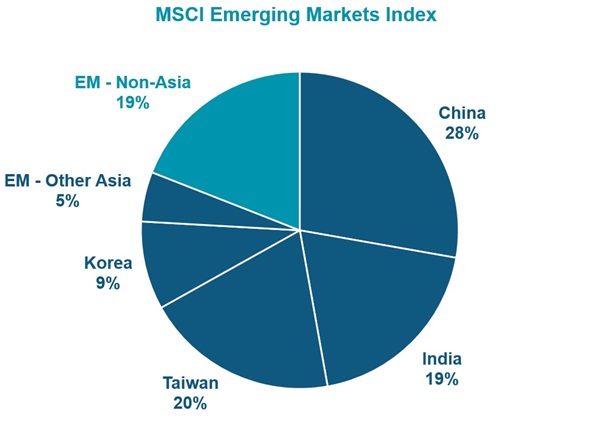
Source: MSCI Emerging Markets Index (AUD) 31 December 2024
Interestingly, these markets are dominated by financials and resources – think Saudi Arabia’s Aramco and Brazil’s Vale. For Australian EM investors that could be suboptimal. It means 20% of their EM exposure is in stocks that are sensitive to interest rates moves and macroeconomic trends. And Australian investors already have a significant exposure to those areas.
By taking the traditional EM route, Australian investors are adding to an already high exposure in miners and financials – and via markets with higher sovereign risk and weaker corporate governance.
Figure 2. Too close to home?
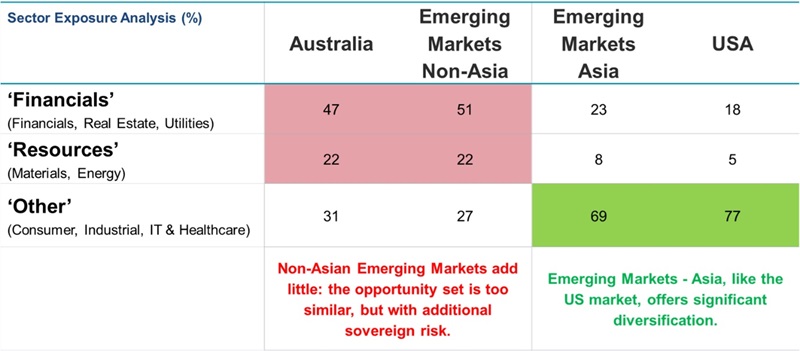
Source: MSCI Emerging Markets Index, MSCI EM ex Asia Index, MSCI USA Index, MSCI Australia Index, MSCI World Index and MSCI EM Asia Fact Sheets – 31 December 2024.
The Asian alternative – ‘TICKing the box?
As we saw above, Asian assets already make up 80% of the emerging market index. The composition of that Asian element is revealing. By value, 95% of that Asian component comes from four markets: Taiwan, India, China and Korea. The good news is that those ‘TICK’ markets offer an attractive diversification from Australia.
Across those four markets the largest sectors include technology, the consumer, health care and industrials. That’s a US-like sector mix with little overlap to the Australian market.
These four markets also span a wide range of economic development.
- India is a low-income, high-growth economy. It has exceptional long-term potential, but monitoring governance and quality is important.
- China’s income per capita (USD14000) is around the global average, but the average masks significant variations. Many rural areas are poor while China’s coastal cities have much higher per-capita income. As we saw with the recent launch of DeepSeek, these cities are centres of technological innovation.
- Korea and Taiwan are classed as emerging markets but their economic infrastructure and technology sectors are at Western levels. Corporate governance is not – but it is improving.
Figure 3. The full spectrum of development (GDP/capita, USD thousands)
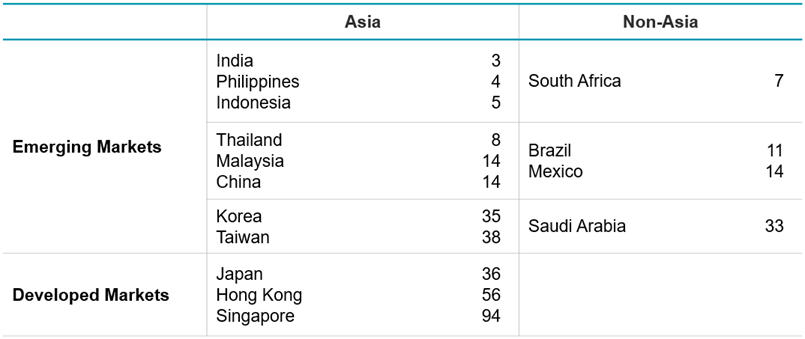
Source: IMF, February 2025
Underlying growth
The attraction of Asia as a replacement for broader EM exposure is underpinned by the region’s superior economic and demographic fundamentals.
Asia hosts 59% of the world population and produces 55% of global GDP. Over the past decade it has been the engine of the world economy, generating 70% of global GDP growth. GDP per capita is growing much faster in Asia than other regions.4
Figure 4. The full spectrum of growth (Forecast GDP growth rates (%) 2025/26 average)
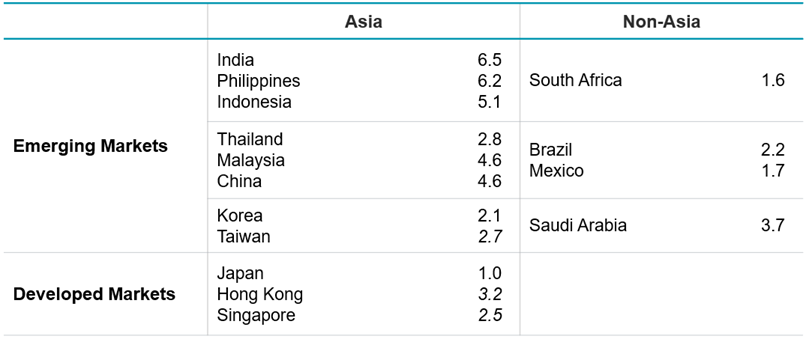
Source: IMF WEO January 2025
Historic outperformance
As you can see below, Asian Emerging Markets have easily outperformed Non-Asia Emerging Markets over the past ten years.
Figure 5. Is Asian EM simply better EM?
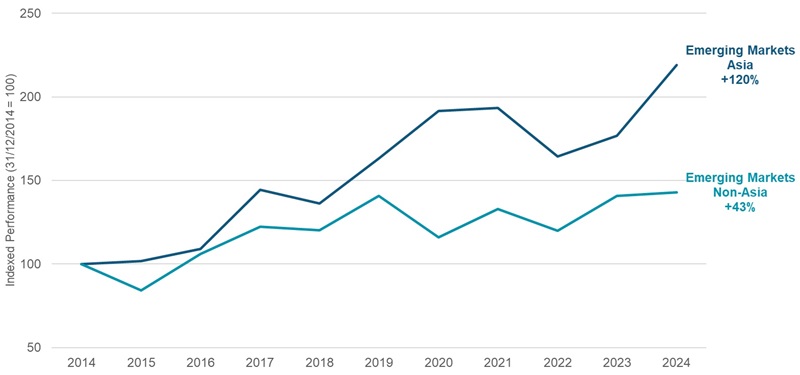
Source: MSCI Emerging Markets Index, MSCI EM ex Asia Index, MSCI EM Asia Fact Sheets – 31 December 2024.
The bottom line - does Asia offer a more efficient EM allocation?
As we’ve shown above, Asia offers attractive demographic and economic fundamentals and good diversification from Australia.5 Crucially, the dominance of the TICK markets – Taiwan, India, China, and Korea – also make it a more efficient source of EM returns.
Typically, investing in Emerging Markets is seen as adding complexity and risk to a portfolio. The trade-off for the growth potential of EM economies is higher sovereign risk and generally weaker governance. For fund managers, managing this risk requires additional effort – and cost.
The dominance of the TICKs, however, means Australian EM investors can benefit from the Pareto Principle (the 80/20 rule). By investing in Asia – where some 80% of market value spans just four markets - fund managers can accumulate deep institutional knowledge, concentrate research resources, capture economies of scale and reduce trading costs.
That may make their EM investing more efficient – and that can mean better outcomes for their investors.
1 Obviously all investment decisions are highly personal and should be discussed with an adviser
2 Source: MSCI – MSCI World/Emerging Markets Indices A$ monthly returns.
3 Source: Factset.
4 Source: worldeconomics
5 There is only a 0.35 correlation between Australian markets and the MSCI EM Asia index. Source: MSCI
Cameron Robertson is a Portfolio Manager – Asia strategies, at Platinum Asset Management, a sponsor of Firstlinks. This information is commentary only (i.e. our general thoughts). It is not intended to be, nor should it be construed as, investment advice. To the extent permitted by law, no liability is accepted for any loss or damage as a result of any reliance on this information. Before making any investment decision you need to consider (with your financial adviser) your particular investment needs, objectives and circumstances.
For more articles and papers by Platinum click here.