The most obvious expectation is that Australian superannuation should have a similar asset allocation as the retirement money in other developed countries. Major asset managers are global, consultants advising big super funds are global businesses, finance executives study the same markets and theories, and investment markets follow a herd mentality. Surprisingly, the differences are stark.
Willis Towers Watson's not-for-profit initiative, The Thinking Ahead Institute, has issued its ‘Global pension assets study 2018’ based on 22 pension markets with assets of USD41 trillion, showing Australia has been the fastest grower over the last 20 years, up 12.1% per annum. This is driven by mandated contributions and dominance of defined contribution schemes. Note that although the study refers to 'pensions', in Australia's case, it includes the entire balance in superannuation funds (pre and post retirement).
What’s most notable is how Australia is an outlier in many important ways, including:
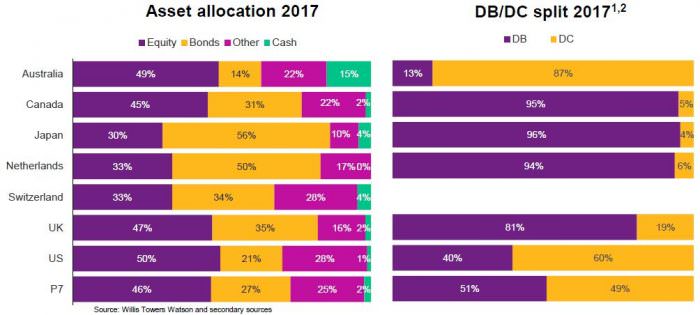
- The highest allocation to equities at around 50% (same as the US) of the 22 countries, with Switzerland and Netherlands as low as 33% and Japan 30%. What do the Gnomes of Zurich know that we don’t?
Asset allocation and DB/DC split in 2017 by country

Equity markets are usually more volatile and subject to larger drawdowns than bonds, leaving Australian savings more exposed to the vagaries of the market. Countering this worry is that fact that shares offer better long-term returns, and with increasing longevity, pensions need to last 30 to 40 years, not the 10 to 20 years of the past. Australia also has relatively high dividend yields and the benefits of franking credits.
(The Australian data uses the ATO's reports on asset allocations, which have shortcomings as documented here, especially in not recognising SMSF exposure to global equities).
The concern about capital protection is one reason why many MySuper funds are ‘target date’ or ‘lifecycle’ funds, where the defensive or bond allocation increases with age.
There is also an issue with sequencing risk, where the market falls heavily shortly before retirement, when pension balances are at their highest, about to face withdrawals to fund a retirement, and with little ability to top up.
For example, on 18 January 2016, the Chairman of the Future Fund and former Treasurer, Peter Costello, wrote in the Herald-Sun about the risk of investing too much superannuation money into shares, including:
“The compulsory superannuation system has hooked the earnings and savings of millions of Australians into the stock market. I don’t think it was a conscious decision. It started off small and now it has grown big. Stocks are at the riskier end of the investment universe. Government policy has directly hooked the wealth of individual citizens to rises and falls in share prices.
Our stock market is still 30% below its level of eight years ago. There’s a lot of lost years for people to make up and a lot of lost wealth. You can see why people prefer to put their voluntary savings in less volatile assets like residential housing. They’re more careful with their money than the Government is.”
- The highest allocation to cash, at a heady 15%, when cash rates are negative in real terms, in contrast to The Netherlands at nil and a global average of only 2%. Do Australian investors use their ‘risk budget’ on equities and compensate by holding lots of cash? There is probably a distortion that explains some of the difference: the Australian numbers include SMSFs, a uniquely Australian vehicle which comprises one-third of all superannuation balances. SMSF trustees are individuals, notoriously conservative and protecting their own capital with cash and term deposits. The Australian number is being compared with predominantly institutional investors in other countries.
- The lowest allocation to bonds at only 14%, versus the global industry average of 27% and a country like The Netherlands as high as 50%. Some of these countries have negative interest rates on their government bonds, although they have a far more active non-government market than Australia. And note previous comment about SMSF allocations.
- The highest proportion of assets in defined contribution schemes (where the amount invested is defined) rather than defined benefits (where the final benefits of the scheme are defined). Defined contributions require the investor to decide how money will be invested (although most are in defaults and do not make an explicit decision on how the money is managed). It is the investor who takes the full risk of the outcome, rather than receiving the protection of a pension with the risk borne by an institution. Australia has only 13% of assets in defined benefits versus over 94% in Canada, Japan and The Netherlands, as shown above.
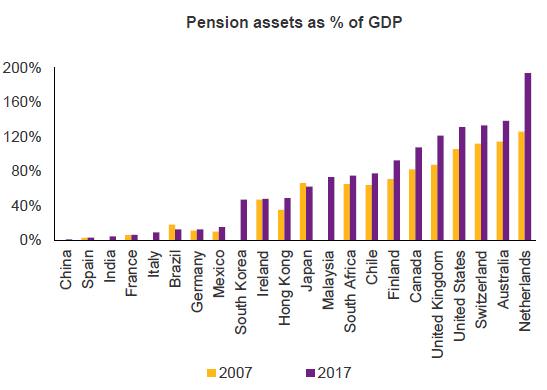
- Australia’s system is second only to The Netherlands in the ratio of pension assets to GDP, showing the maturity of our compulsory superannuation system relative to the size of our economy. Pension assets now stand at 138% of GDP. This looks like it’s up from 114% in 2007, but the 2017 data includes SMSFs.

Other comments by the Thinking Ahead Institute include:
- Global institutional pension fund assets in the 22 major markets reached USD41 trillion at year end 2017, increasing USD5 trillion over the year.
- With DC models in the ascendancy, it is important that governance issues and the shift in risk on to the end-saver are closely monitored.
- Reduced home bias for equities in the last 20 years, falling to 41% in 2017 from 69% in 1998. Private assets rose from as little as 4% of allocations in 1997 to around 20% today, showing a sophistication of strategies in allowing funds to go beyond traditional means of diversification.
Graham Hand is Managing Editor of Cuffelinks. The Thinking Ahead Institute is a global not-for-profit member organisation whose aim is to influence change in the investment world for the benefit of savers. The Institute is an outgrowth of Willis Towers Watson Investments’ Thinking Ahead Group. The full study is linked here.