In December 1996, the two words, irrational exuberance, spoken by Alan Greenspan, then Chairman of the US Federal Reserve, became forever burned into financial market psyche. US equity markets had risen by 126% over the five preceding years, stretching equity market valuations in the process. As Robert Shiller, an economics professor at Yale University describes, Mr Greenspan was delivering a speech titled, “The Challenge of Central Banking in a Democratic Society”. Fourteen pages into that speech he posed the rhetorical question, “But how do we know when irrational exuberance has unduly escalated asset values, which then become subject to unexpected and prolonged contractions”, adding later that “we as central bankers need not be concerned if a collapsing financial asset bubble does not threaten to impair the real economy”. His speech was being televised live and immediately after he made this famous statement, the Japanese stock market fell, closing 3% lower, followed by a 4% fall in London and a 2% fall at the open of US market trading.
At what point are markets seriously expensive?
The question he had posed encapsulated the underlying fear of investors who had witnessed a nine-year long bull market run. In the grip of the new dot-com world, had investors gotten carried away and lost sight of valuations? With the S&P 500 trading on a historical Price to Earnings (P/E) ratio of 21 times, were markets being irrationally exuberant?
While his question captured the zeitgeist of the time, equity markets quickly shrugged off Mr Greenspan’s ruminations. The US stock market rallied strongly for four more years, rising another 116% before it reached its dot-com boom peak in late 2000, after which it fell by 47% over the following two years. While the correction did ultimately validate Mr Greenspan’s musings, it also highlighted the folly of trying to pick market tops and bottoms. An investor who had bought the S&P 500 on the day of Mr Greenspan’s speech would still have been 13% up at the bottom of the market crash in 2002.
Twenty years on from Mr Greenspan’s famous warning about asset price bubbles, a similar fear hangs over equity market investors today. As equity markets around the world are near all-time highs, valuations once again look elevated, leading many commentators to question the sustainability of current prices. A commonly-cited metric used to uphold the overvaluation argument is the Cyclically Adjusted Price to Earnings Ratio (CAPE), otherwise known as the Shiller P/E. The premise of CAPE is that valuing a firm based on one year of earnings is a poor predictor of future returns. Instead the CAPE draws on the work of value investors such as Benjamin Graham and David Dodd who argued for smoothing a firm's earnings over five to ten years when assessing its intrinsic value.
CAPE uses ten years of inflation-adjusted S&P 500 earnings as its denominator when calculating a P/E ratio for the market. Mr Shiller and his index rose to fame after the publication of his 'Irrational Exuberance' book which argued that the stock market had become a bubble. Demonstrating a serendipity of market timing that had eluded Greenspan, Shiller’s book was published in March 2000, just months before the start of the market crash. The Shiller P/E as a powerful tool has stayed with investors since, and he won the Nobel Prize in 2013.
The Shiller P/E of the S&P 500 today trades at about 29.2, well above its long-run average of 16.7. It was 10 years ago this month, May 2007, when the CAPE reached its peak in the last market cycle, at 27.6. The S&P 500 then suffered one its worst corrections in history. In a similar vein, if we ignore the five-year period of the dot-com boom, the last time the US equity market traded at Shiller P/E ratio of over 29 was just before the market crash of 1929.
One valuation tool tells only part of the story
When presented like this, current market valuations using the Shiller P/E provide cause for concern, especially since the bull market in US equities is now eight years old, making it the second longest bull market on record. The problem with using market valuation tools like the Shiller P/E however, is that it is not possible to condense all relevant market factors into one single measure.
Take the notion that we should average company earnings over several years to establish a reliable basis for pricing future earnings potential. In practice, a simple average of a randomly chosen number of years is open to large distortions. In the case of the current Shiller P/E ratio, the 10-year trailing average earnings includes the 2008/09 financial crisis. As the chart below shows, real S&P 500 earnings per share fell by 90% during this period, to a level not seen since the depression of the 1930s.
Real S&P500 Earnings in $/share
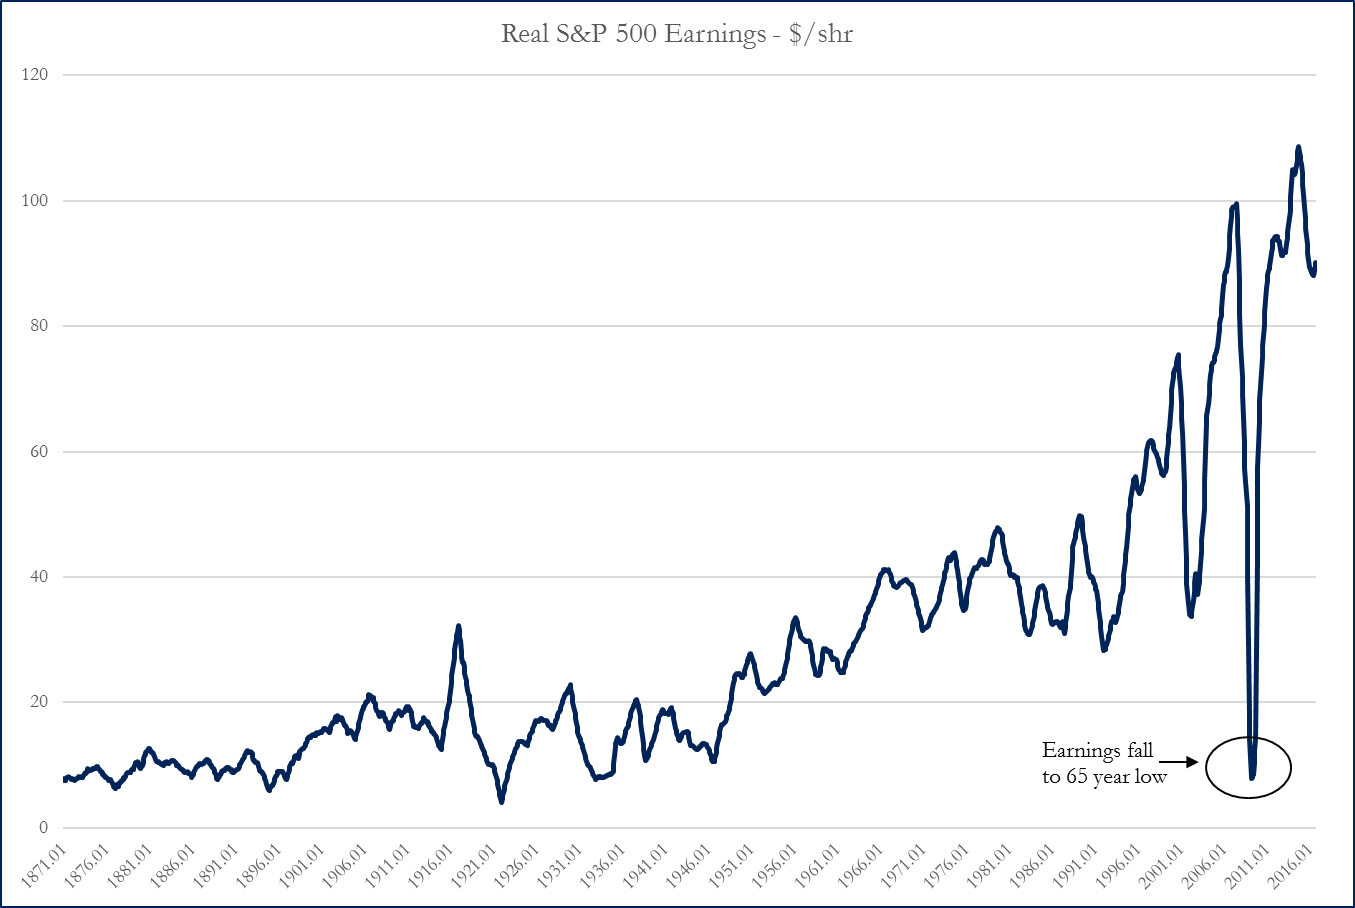
Source: Robert Shiller
This earnings crash was a short-lived affair. Within three years, market earnings had largely recovered to their pre-crisis levels. If we were to thus calculate the Shiller P/E using a trailing five-year average, instead of a 10-year average, the resulting market multiple falls to 24.3, which is below the 20-year average of 24.6. Future signalling problems must cope with the 2008/09 earnings period falling out of sample.
Lastly, while many pundits like to compare the Shiller P/E ratio to its long-run average of 16.7, most fail to explain that the data Robert Shiller provides stretches back to 1871, and current interest rates are well below long-term measures. US benchmark interest rates as provided by Mr Shiller back to 1871 average 4.6%, twice the current benchmark rate of 2.3%, which is what the market uses to price assets from today. Low interest rate environments inflate asset prices while high interest rate environments depress them. The Shiller P/E ratio reached its post WWII low of 6.6 in 1982, when US benchmark interest rates were 14%. That current market P/E multiples, Shiller or otherwise, look inflated against their long-term averages mainly tells us that current interest rates are low relative to history.
I have no special insight into whether we might be nearing a point of irrational exuberance, but a selective focus on simple valuation metrics is inherently flawed. While identifying asset price bubbles is easy in hindsight, one hard rule is that they are impossible to identify in advance. It is doubtful the current hand-wringing on the high Shiller P/E provides us with any real information on where markets go to from here.
Miles Staude is Portfolio Manager at the Global Value Fund (ASX:GVF), which he manages from London. This article is the opinion of the writer and does not consider the circumstances of any individual.