There is a long-held pattern in markets:
- Consumers and businesses become accustomed to prevailing interest rate conditions.
- The situation changes, and then rates rise rapidly.
- Interest rates hit a level that becomes restrictive, high enough to slow activity. Two signals that become restrictive are:
- Activity in interest-rate-sensitive industries, such as housing and used car sales, contracts.
- The yield curve (the difference between 10-year and six-month interest rates) turns negative.
- From that point, when interest rates become restrictive, 12-18 months later, activity starts to contract, company profits start falling, layoffs rise, and stock prices tend to fall.
Historically, it has been worthwhile paying attention to when this interest rate pattern started unfolding - and we are seeing this same pattern unfolding today.
Reasons for caution
For over a decade, we have lived in a world of record-low interest rates, which we all became very accustomed to.
The factor that changed was inflation. Central banks globally have responded by increasing interest rates very quickly to combat rising inflation. This has been the sharpest increase in US interest rates in 40 years, as illustrated in Fig. 1.
Fig. 1: Rates have gone up very fast, but the impact lag is 12-18 months
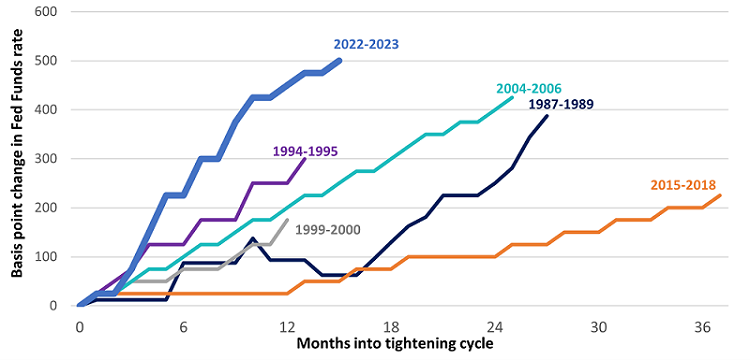
Source: Evercore ISI Research, as at 12 May 2023.
We are getting the signal that rates are now firmly in restrictive territory. We can see that in the deeply inverted yield curve – it is now the most inverted yield curve since the early 1980s, after inverting in August 2022. At the same time, we started to see a recession in housing, and used car prices started to fall.
Fig. 2: US yield curve is the most deeply inverted since the early 1980s
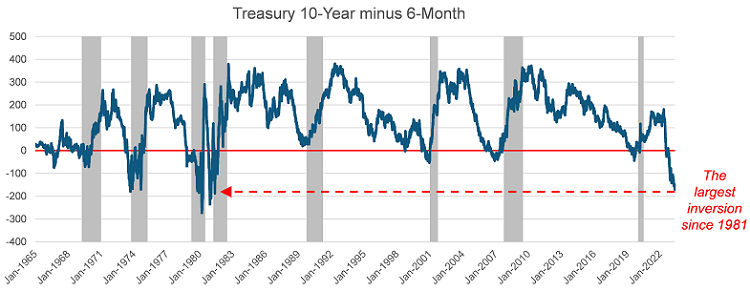
Source: FactSet Research Systems, as at 15 May 2023. Note: Grey-shaded areas indicate GDP-based recession.
The number of leading economic indicators flashing recession continues to build. The Conference Board Leading Economic Indicator (LEI), a composite measure that combines a number of leading indicators such as manufacturing orders, freight volumes, business confidence, and bank lending, is signalling a recession over the next 12 months. We are also seeing a significant number of layoffs in the tech sector,[1] problems in commercial property with office vacancy rates rising to all-time highs (with WFH a contributing factor) and asset values falling, and four major banks collapsing.
Fig. 3: The US LEI signals a recession over the next 12 months
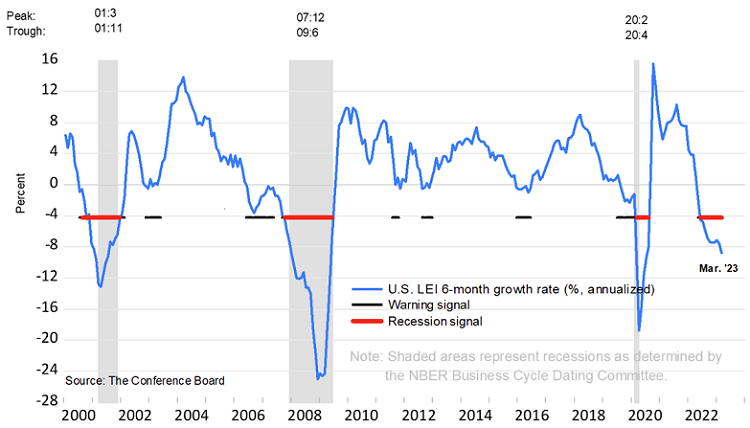
Source: The Conference Board, as at 11 May 2023.
So, this long-held historical pattern is playing out in front of our eyes. Our simple response is that it calls for caution.
We also need to keep in mind that one of the all-time great ‘super bubbles’ in the last 100 years has now burst. Favourite stocks of the day, many of which were loss-making businesses trading on astronomical valuations in 2021, have seen their prices plummet. The post-COVID bubble of 2020-2021 was truly enormous, and we will most likely look back on that period like we do with the 2000 tech bubble. It has all the same ingredients.
Fig. 4: The air pressure test: Valuation of software as a service (SaaS)/disruptors
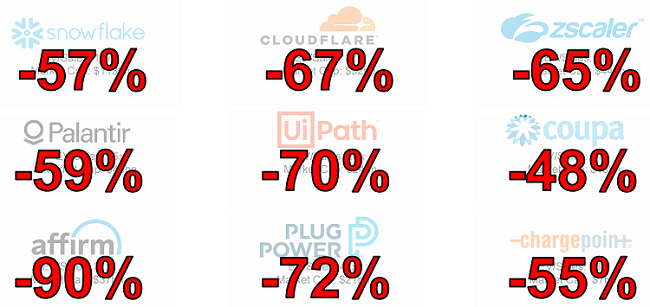
Source: FactSet Research Systems, as at 12 December 2021.
EV: Enterprise Value. Sales data is the latest completed period figure.
Jeremy Grantham, the co-founder of GMO, has specialised in studying the great super bubbles of history. His work showed that the super bubbles were in a class of their own and given the sheer excess required to generate the bubble, the hangovers tended to be very different from the usual stock market downturn.
In 2021, we had some wild excesses: zero interest rates, record stimulus and incredible speculation in things like cryptocurrencies. There have been seven super bubbles in the last 100 years (1929, 1972, 1989, 2000, 2007, 2008, 2021).[2]
Following the bursting of these super bubbles, on every occasion we experienced:
- A decent recession
- A fall of at least ~50% in the broad stock market from peak to trough.[3]
Now, history doesn’t have to repeat itself, but when we combine that precedent with the business conditions outlined earlier, we feel there is a need for caution and to avoid the eye of the bubble.
Reasons for optimism
Whenever you’re looking at the big picture, you need to maintain a balanced view, and there are positive factors that are also in play.
China is in a completely different economic phase from the other major countries. China has just experienced its worst recession in 20 years, and its economy went through the COVID experience without fiscal or monetary stimulus, resulting in a 50% fall in housing sales and a decline in retail sales,[4] whereas in the West they boomed due to stimulus cheques. However, the about-face on its zero-COVID policy should see the economy recover. We are seeing the first signs of that recovery coming through, and the government is very clear they want to boost domestic consumption.
What does that mean for the rest of the world? The old adage was that when the US economy sneezes, the rest of the world catches a cold. This was because the US economy and capital market were so much larger than every other country.
The difference today is that the Chinese economy is only ~20% smaller than the US, which is the closest single country to rival the US in size since Japan in the 1980s, but even then, the Japanese economy was about 40% smaller.[5]
So, we have two big economic engines; one is sputtering, and we expect the other to grow, and for certain goods and industries, the Chinese economy is likely large enough to offset some of that recessionary pulse out of the US.
The other positive is employment. To date, in both Europe and the US, employment has been considerably stronger than many expected. Europe managed to shake off a major energy crisis and unemployment did not weaken, while in the US, we are only just seeing the first hint of a pick-up in unemployment claims.[6] Compared to history, the labour market is still incredibly strong in both economies. We would also add that the Australian consumer has remained incredibly resilient in the face of higher mortgage rates. So, we need to respect that resilience.
The third positive factor is cautious investor sentiment. While investors are certainly not panicked, there is an undercurrent of concern, and this means investors are generally more mentally prepared for tougher times ahead. Once investors have had time to digest the prospect of problems, they are more likely to look through them.
We also need to note that last year, the broad US and European stock markets fell around 25%. After accounting for inflation, in real terms, the fall was more like 35%, which historically is a pretty decent fall.[7]
Opportunities
While we are cautious about how the business cycle is developing in the US, as investors, we need to keep our eyes wide open to what is happening and opportunities.
China has been in one of the all-time great bear markets. The Hang Seng China Enterprises Index (HSCEI), comprising prominent mainland Chinese companies listed in Hong Kong, fell 60% from its most recent peak in February 2021 to October 2022 and is still down 44%.[8]
Fig. 5: Hang Seng China Enterprises Index – Still well below its 2021 highs
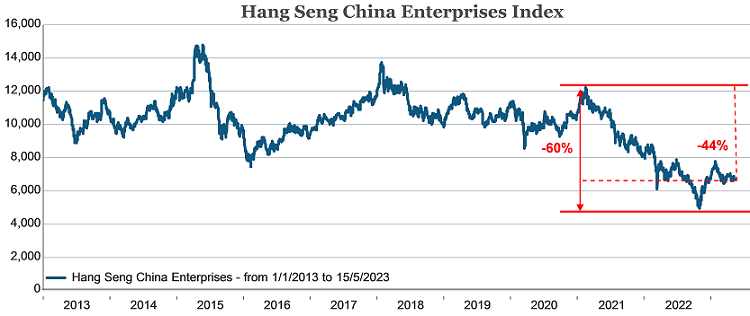
Source: FactSet Research Systems, as at 15 May 2023.
The market fall was driven by the zero-COVID policy-induced recession plus extreme fears over geopolitics. So, we are starting from a position of deep investor negativity, with an economic recovery on the horizon being a large positive, as mentioned above.
One of our holdings in China is AK Medical, the country’s largest domestic manufacturer of orthopaedic products (mainly hip and knee). AK has been the most R&D focused of the domestic players, building a 20% market share and being the first to gain approvals for a number of its 3D-printed/more innovative implants.[9]
Mispricing opportunity: The stock was heavily sold down due to the short-term impact of winning the new volume-based procurement (VBP) system on their profits. In winning the contract, AK is providing the health system with a low-priced line of five standard hip and knee implants, that will be sold in high volume.
What are positives looking forward?
- Significant expansion of surgeon relationships. In orthopaedic implants, the buying decision is made by the surgeon, and companies go to great lengths to familiarise surgeons with their products. Post winning the VBP, AK’s medical implants will be used by 90% of Chinese hospitals, and AK is building relationships with thousands of new surgeons, who can be introduced to AK’s higher-priced products in time.
- Chinese government’s push for self-reliance. After the US government’s semiconductor chip bans, the Chinese government has been encouraging domestic companies to make higher-end goods, including medical products. To date, the Chinese implant market has been dominated by foreigners, with around 50% of the market held by US companies like Johnson & Johnson and Stryker.[10] The Chinese government is reimbursing surgeons who use domestically made implants. This has seen companies like AK Medical win share from foreigners.
- A relatively small and nascent orthopaedic implant market. Implants per 1,000 head of population are five times higher in Japan and Korea and ten times higher in Europe and the US than they are in China. Orthopaedic procedure rates are strongly correlated with the standard of living, and as the middle-income group grows, we believe the orthopaedic market in China has the potential to double or triple from current levels.
In Europe, we have a holding in Infineon Technologies, the leading supplier of high-end power semiconductors for automotive and industrial customers. These chips are critical in converting and managing power from, say, an electric vehicle battery to the required voltages of all the components. Infineon also produces a range of automotive-specific microcontrollers that benefit from the growing electrical complexity of cars.
Mispricing opportunity: Last year, you could buy Infineon on 12x earnings as investors were worried about a downturn in the semiconductor cycle and a recession in Europe due to gas shortages. Ultimately, we believe this company has a nice growth runway ahead, and we felt that the market was undervaluing this potential, so we started building a position in the stock over the course of 2022.
Three key growth drivers:
- Shift to electric vehicles. EVs have six times the power semiconductor content of internal combustion vehicles.
- Shift to advanced driver assistance. Cars are getting more and more computation power, which further increases the power semiconductor content.
- Bias to electrify (heating, etc). Heat pumps and solar inverters require more power semiconductors.[11]
Summary
The environment sounds daunting; however, we believe we must keep in mind the incredible buying opportunities and long-term wealth that can be built if you are willing to invest in these environments. These cycles are nothing new; we just need to understand them and take advantage of them.
In that regard, we will continue to invest in companies that can still grow in this environment or have already priced in their recession, all the while remaining disciplined on valuation and what we are paying.
1. Source: Evercore ISI Research.
2. Source: 1929 bubble: Dow Jones -87%; 1972 Nifty Fifty bubble: S&P 500 -48%; 1989 Japan bubble: Nikkei -63%; 2000 1st Tech bubble: S&P 500 -48%; 2007 Chinese stock bubble: SSE -71%; 2008 US housing bubble: S&P 500 -56%; 2021 Tech, ‘Disruption’ and COVID spending bubble: S&P 500 -25%. Source: FactSet Research Systems.
3. Source: FactSet Research Systems.
4. Source: citi.
5. Source: IMF.
6. Source: Europe: FactSet Research Systems; US: Federal Reserve Bank of St. Louis.
7. Source: FactSet Research Systems.
8. Source: FactSet Research Systems.
9. Source: Company reports, Bloomberg.
10. Source: GlobalData.
11. To hear more about Infineon Technologies see our video: https://www.platinum.com.au/Insights-Tools/The-Journal/Power-Semiconductors-Powering-Our-Lives
Clay Smolinski is Co-Chief Investment Officer and Portfolio Manager at Platinum Asset Management, a sponsor of Firstlinks. For more articles and papers by Platinum click here.
View Disclaimer: This article has been prepared by Platinum Investment Management Limited ABN 25 063 565 006 AFSL 221935 trading as Platinum Asset Management (“Platinum”). While the information in this article has been prepared in good faith and with reasonable care, no representation or warranty, express or implied, is made as to the accuracy, adequacy or reliability of any statements, estimates, opinions or other information contained in the article, and to the extent permitted by law, no liability is accepted by any company of the Platinum Group or their directors, officers or employees for any loss or damage as a result of any reliance on this information. Commentary reflects Platinum’s views and beliefs at the time of preparation, which are subject to change without notice. Commentary may also contain forward-looking statements. These forward-looking statements have been made based upon Platinum’s expectations and beliefs. No assurance is given that future developments will be in accordance with Platinum’s expectations. Actual outcomes could differ materially from those expected by Platinum. The information presented in this article is general information only and not intended to be financial product advice. It has not been prepared taking into account any particular investor’s or class of investors’ investment objectives, financial situation or needs, and should not be used as the basis for making investment, financial or other decisions. You should obtain professional advice prior to making any investment decision. You should also read the latest Platinum Trust® and Platinum Global Transition Fund (Quoted Managed Hedge Fund) product disclosure statement and target market determination before making any decision to acquire units in the funds, copies of which are available at www.platinum.com.au/Investing-with-Us/New-Investors.