There is no one single magic formula for successful stock picking. Here at Cuffelinks we have seen articles espousing many different ways of picking stocks, notable examples being to focus on value and quality. These ideas all have merit. In this article, I work through one example: the phenomena that winning stocks continue to outperform losing stocks, known as ‘the perseverance of winners versus losers’. It sounds rather novel, simple and surely too good to be true …
The theory
In 1993 academics Narasimhan Jegadeesh and Sheridan Titman wrote what has become a well-known paper titled, “Returns to buying winners and selling losers: implications for stock market efficiency”. They found in the US stock market that buying the top performing stocks from the previous period (3 to 12 months) and selling short the bottom performing stocks from the same period resulted in significant outperformance over a holding period of 3 to 12 months.
For the academic world this caused a lot of kerfuffle as it threw a spanner in the works of those who proclaim that markets are perfectly efficient: how could such a simple look-back strategy perform so well?
Subsequent research demonstrated that the effect has worked internationally, and recent research suggests it continues to work today. Researchers have attempted to explain the perseverance of winners versus losers, some as a reward for taking on some risk loading and others as a behavioural phenomenon. The behavioural arguments sit better with me.
Applying winners versus losers to Australia
Does the strategy work in Australia? Cuffelinks isn't really the forum for academic research tests of such detail, so I produce a simplified analysis. For each of the last 10 financial years I run the following analysis:
- At the start of each financial year I go long an equally-weighted portfolio of the previous financial year’s top 10 performing stocks on the ASX 200
- I also short an equally weighted portfolio of the previous financial year’s worst 10 performing stocks on the ASX 200
- I hold this portfolio for the subsequent financial year (ie a 12 month holding period).
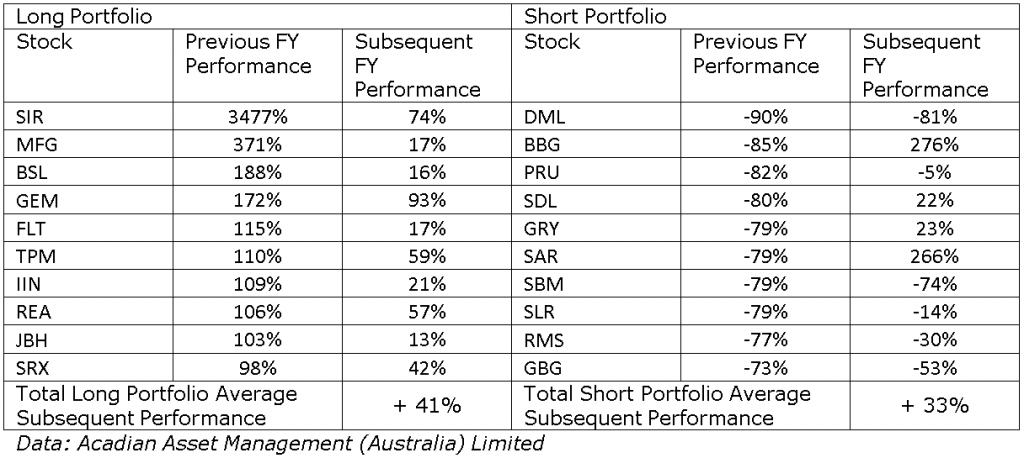
As an example, the table below lists stocks I would have held during the previous financial year (2013/2014), along with subsequent performance.

Using the table above if I subtract my short performance (+33%) from my long performance (+41%) I end up with a total performance of 8%.
The last financial year has been one of the least impressive for this strategy but is still positive; looking back this quite simple strategy looks to have been highly successful. The charts below present the 10 year track record.

The left chart displays the subsequent performance for both winner and loser portfolios, while the right chart shows the annual net returns from going long winners and short losers, along with an index of compounded performance (starting at value 100). Positive performance is seen in those years that the winners on average outperform the losers, which is seen in all except one year. In 2007 the winners perform very strongly over the subsequent 12 months, and the losers continue to underperform leading to a very strong net result. However in 2009, the winners only marginally outperform, whereas the shorts hurt net performance with the rally in previous loser names as the market turned strongly positive in March 2009.
This strategy appears to have surprisingly good performance. The annualised performance would have been 25%, but the results are highly volatile (the standard deviation of annual returns was 32%). And though a rather naïve strategy, the results appear significant (see this Cuffelinks article for an explanation of a significant result). The strategy has no inherent market exposure as you are taking equal sized positions long and short. In fact you would earn some additional cash deposit returns in your portfolio (I won’t bog you down with an explanation of why).
To be honest, ‘strategy’ is too generous a word to describe this simple analysis. It shows no concern for sector exposures nor does it re-balance stock positions or net market exposures throughout the year. There are also some practical limitations to implementing such a strategy. The main one is shorting, as it may prove difficult to achieve a short position in each loser stock. Someone needs to be happy to lend out their stock, thereby adding to the downward momentum in the stock price.
Nonetheless the strategy is interesting and can be used in benchmarked funds as well, where losers may not be held in the fund giving a benchmark underweight without requiring shorting. The winners versus losers phenomenon forms the basis on which the momentum signal, used by many global quantitative equity managers, is built.
Behavioural explanations
There are many explanations proposed for the perseverance of stock market winners versus losers. One explanation was the possibility of uninformed traders who simply follow the trend in prices. Another example suggests that investors switch from underperforming to outperforming funds and this creates a flow of capital that creates momentum. It is likely that there are many reasons that contribute to explaining the momentum phenomenon.
Takeout messages
Of course I am not recommending you go out and replicate this ‘strategy’ – I wouldn't myself. The point of my article is to illustrate that there are many different ways to pick stocks. Some are based on company analysis, some are technical, and some are behavioural. You need to pick out the approaches that you believe you can execute well and understand the strengths and weaknesses of your approach and the environments in which it will work and in which it may struggle.
David Bell is Chief Investment Officer at AUSCOAL Super. He is also working towards a PhD at University of NSW.