If you follow basketball, as I do, the words “trust the process” have a special meaning. Now a part of the lexicon that has expanded well beyond its origins, it was originally used to describe the approach taken by the Philadelphia 76ers, a basketball team that elected to repeatedly lose to improve their chances to draft the best basketball players coming into the league.
With the RBA’s decision to keep interest rates on hold this month, it is “trusting the process” that interest rate increases to date will eventually bring inflation down to the target range of 2-3%.
But its thesis that higher interest rates will eventually weigh on consumers (and house prices) has yet to be borne out. Is the RBA early or is it wrong?
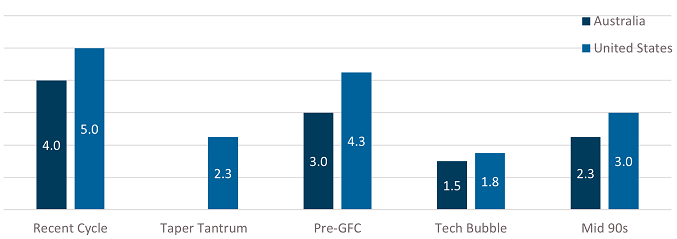
We know the recent increases in interest rates are significant, but the below chart places them in some context. They are the largest in recent history and in the case of Australia, the largest by some margin.
The biggest hiking cycle of the last 30 years – 12-month change in cash rate

Source: Bloomberg
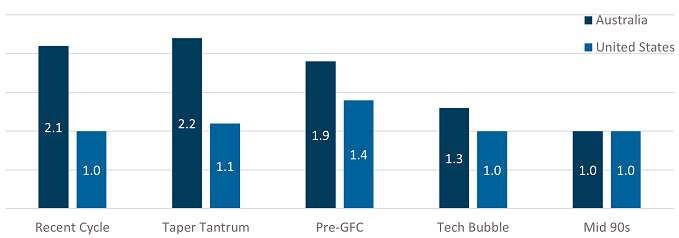
Add to this the overall level of debt. Unlike the US where household debt has declined relative to incomes since the global financial crisis, in Australia household debt is close to the peak (and well above the peak in the US pre-GFC era).
Australia is exposed – household debt to net disposable income

Source: OECD
So, if this is the case, then why are house prices rising and the consumer proving to be so resilient? Is the RBA right to trust the process or is it missing something? Is it early or is it wrong?
The argument for being early
A possible explanation is there are lags in monetary policy flowing through to the end consumer. This is the case in all scenarios but there are reasons to believe the effect will be more pronounced this time around.
Firstly, the well-documented fixed rate mortgage cliff. According to the RBA, fixed rate mortgages went from around 20% of all mortgages in 2019, to almost 40% at the peak. They are expected to decline to less than 10% over the next 12 months. Fixed rate mortgages delay the transmission of monetary policy.
Two, the role of banks. Banks have been aggressively chasing market share and not passing on all of the interest rate increases from the banks. Back in April, the RBA reported that only 250 basis points out of the total of 300 basis points in hikes had been passed on by the banks. It’s likely that this 50 basis point differential is not going to increase further from here as banks have indicated that they are pulling back from competition in mortgage markets.
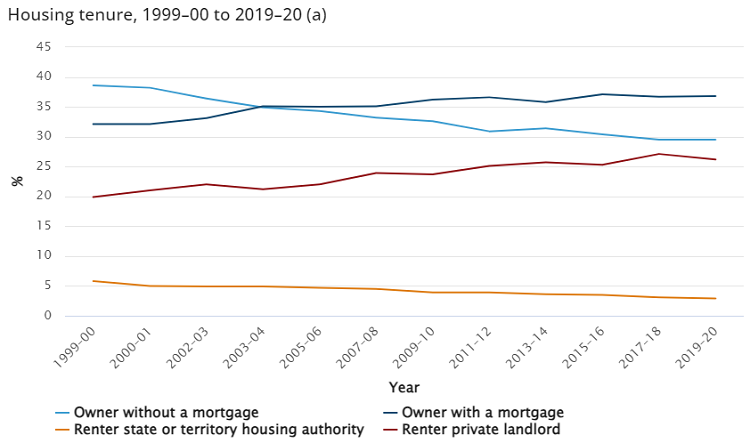
Three, the impact of households who don’t have a mortgage and low levels of debt. According to the ABS, around one third of Australian’s own their own home without a mortgage. This cohort is faring better under higher interest rates and thus in a position to bid up asset prices. At a point the impact of higher rates on owners with a mortgage (and renters) will offset the impact on those without a mortgage but this inflexion point will be difficult to predict (for us and the RBA).

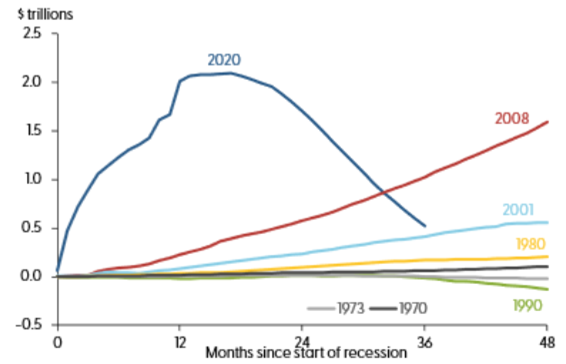
Lastly, the impact of the excess savings built up during COVID has yet to be drawn down. In May, the Federal Reserve Bank of San Francisco estimated that US$2.1 trillion in excess savings was built up during COVID with US$500 billion in excess savings remaining. As the chart below shows, if the current drawdown of excess savings persists, it will be another 12 months before the excess savings accumulated during 2020 and 2021 are exhausted.
Aggregate excess savings following onset of recessions

Source: Federal Reserve Bank of San Francisco
The argument for being wrong
Despite these arguments for patience, the RBA could be wrong. Here are some reasons why:
Sizeable immigration flows causing scarcity in rental properties and inflation in rents. This has been well publicised and a topic we have explored previously. During COVID vacancy rates declined sharply reaching 1% nationally before climbing slightly to settle at 1.2%. The all-time low was 0.8% in 2006. Pre-COVID vacancy rates were 2-2.5%. To normalise, we would need to see another c. 40,000 properties available immediately plus whatever new stock is required to offset immigration flows.
Despite this figure seeming enormous, 40,000 properties are less than 0.4% of total housing stock. Put another way, an increase of 0.01 people per household would free up an additional 40,000 properties. During COVID average household sizes declined by 0.05 people per home. During recessions average household sizes increase and our view is that cost of living pressures will mean this cycle is no different. Seeing this normalise to pre-COVID levels would be equivalent to an additional 200,000 properties being freed up.
Add to this the 240,000 dwellings still under construction, still close to the all-time high of 243,000. While new housing approvals are falling off a cliff with a bottom yet to be found, there is a significant backlog of yet to be completed projects. An important question for the market is whether these projects will ever be completed and if so, how quickly.
The final point here is immigration flows. Could they overwhelm the trends mentioned above? In 2022 our population grew by close to 500,000 people, the fastest pace since 2008. 75% of the growth came from overseas migration. Most of this appears to be a result of less people departing Australia rather than more people coming. Our interpretation is that this is reflective of temporary visa holders coming back to the country. Even if we assume that this is a “catch up” and not suggestive of permanently higher migration, there are still another 2 years of elevated migration to come, implying that circa 200,000 new households will be created each of the next two years. This exceeds the existing 240,000 dwellings under construction plus c. 120,000 of new dwellings being approved per annum.
In summary, we think the RBA will be watching closely for signs that household sizes will increase as this still seems to be a major swing factor. If they don’t increase, it’s a sign that households are potentially not feeling enough pressure and interest rates may need to increase further.
What goes up must come down. If interest rate increases are going to put pressure on the consumer, then declines in interest rates should alleviate that pressure. While interest rate futures markets in Australia are pricing another two hikes to a 4.6% cash rate, there are cuts priced immediately thereafter. The front end of the interest rate curve is inverted with the one-year rate 0.35% higher than the three-year rate. The US equivalent is even more pronounced with the one-year rate close to 1% higher than the three-year rate.
Indeed, despite near term expectations of more rate increases to come, longer term interest rates remain below current cash rates suggesting the view that consumers will eventually buckle is consensus. Conversely, the worse things get for the consumer, the more likely that rates will be cut and the pressure valve on consumers released. The key is that expectations that central banks will come to the rescue remains intact. In other words, do we still believe in the central bank put?
Ultimately, it all comes down to the price
Right now, credit spreads are closer to the tights of the trading ranges of the last 12 months. Excluding March of 2020, credit spreads are closer to the tights of the last decade than the wides. This is despite long term risk government bond yields being within 0.50% of the peak level of rates of the last decade, around 3.7% higher than the lows of 2020.
This solidifies our view that there is still a lot more to gain from being patient than we can lose from being wrong.
Like the RBA, we’ll continue to trust the process.
Pete Robinson is Head of Investment Strategy – Fixed Income at Challenger Investment Management. This article contains general information only, and does not take into account your investment objectives, financial situation or particular needs.