Register For Our Mailing List

Register to receive our free weekly newsletter including editorials.

Home / 599

UniSuper’s boss flags a potential correction ahead

UniSuper’s John Pearce is one of the most respected fund managers in the country. When he speaks, people listen.

In a recent update to members, he outlined his thoughts on 2024 and what lies ahead.

Pearce says the optimal strategy for last year would have been threefold:

  • Owning growth over defensive assets
  • Having international assets, especially US tech
  • Favouring listed over unlisted assets.

Figure 1: 2024 market performance

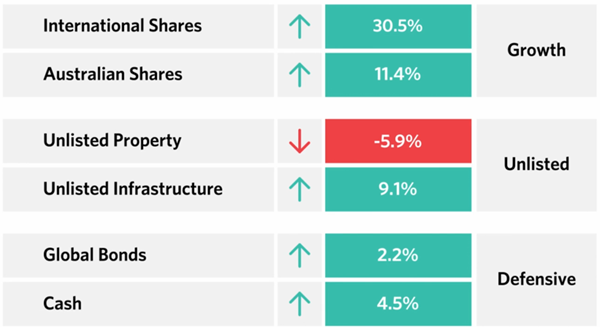
12 months to 31 December 2024. Past performance is not an indicator of future performance. Source: UniSuper.

The thing that strikes your author about this chart is the underperformance of unlisted assets. We’ve heard a lot of noise about the superior performance of unlisted over listed assets, yet this wasn’t the case last year.

To his credit, Pearce had flagged in late 2023 that unlisted assets were looking pricey, and that may be part of the reason for them lagging listed assets last year.

Also to his credit, Pearce was reasonably bullish on markets at the beginning of 2024.

These calls helped UniSuper’s funds last year. Its Balanced fund performed better than the peer average, returning 11.72% for the year, while its Sustainable Balanced option was among the best in class, returning 15.25%. The reason for the latter was it overweighting listed assets, and especially US tech.

Pearce notes that index funds outperformed most super funds over the past year. Why? Pearce says that’s simple: they didn’t own unlisted assets.

He says that while index funds performed well in 2024, it’s not always the case. Over a 10-year period, UniSuper’s Balanced and Sustainable Balanced options have handily beaten all the index funds, with annual returns of 7.92% and 7.79% respectively.

What’s moving markets now?

Pearce gave his take on the two big issues moving markets right now: DeepSeek and Trump. On DeepSeek, he admitted he hadn’t heard of it until a few weeks ago.

Put simply, DeepSeek is the Chinese equivalent of ChatGPT. The big news has been that its engineers been able train DeepSeek at a cost of just US$6.5 million. That compares to ChatGPT’s US$100 billion and Meta’s equivalent, Llama, at US$500 billion.

The market freaked out because it was afraid that the big US tech companies were blowing a lot of money on Nvidia chips and data centres and the like.

Fast forward to today, and the market seems more sanguine about DeepSeek. The US tech companies have reconfirmed that they’ll be spending hundreds of billions to continue to develop AI models.

Pearce doesn’t say whether this is prudent or not, but is bullish on AI’s implications for business, as “cheaper technology is the single best way for businesses to improve their productivity.”

He suggests that while AI’s benefits are overstated in the short term, they’re understated in the long term.

Turning to Trump, Pearce says he was elected to move fast and break things, and that’s exactly what he’s doing. Despite a flurry of daily announcements, the key one that Pearce is keeping an eye on is tariffs. He says that if it ends in a trade war, “it is going to be bad for the economy, bad for business, and bad for share markets.” Pearce hopes that cooler heads prevail on the issue.

The crystal ball for 2025

To this year and Pearce jokingly says that the year of the snake has not been auspicious for markets in the past. On the other hand, the fifth year of each decade has produced the best returns through history.    

More seriously, he notes that two years in a row of +20% returns for the S&P 500 is rare, and a third year of such returns is rarer still.

Figure 2: 151 years of S&P500 returns

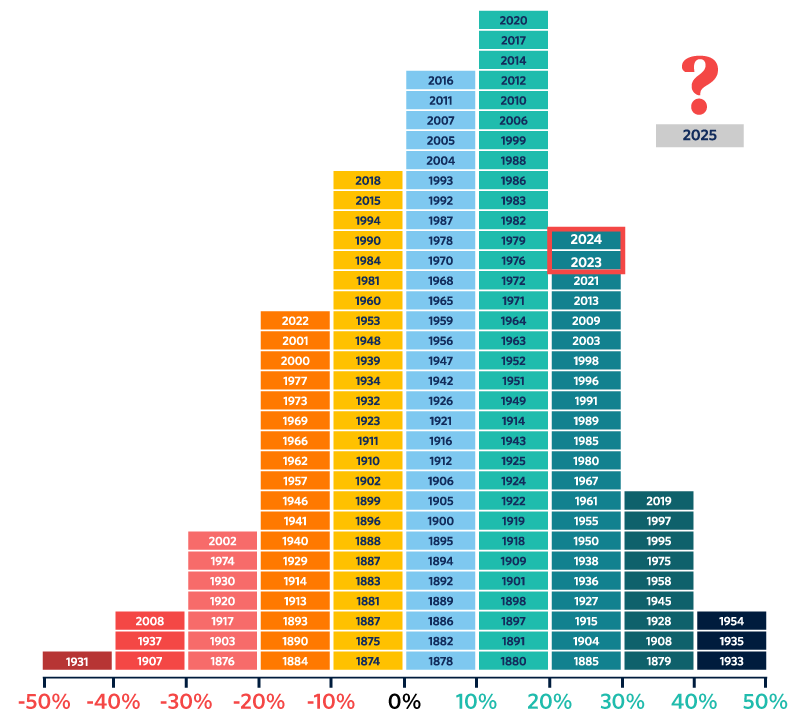
Source: Global Forecast Series, Unisuper

In fact, three consecutive years of +20% returns have happened just once – when the US economy was recovering from a deep recession in the 1990s.

Pearce says that the third year of bull markets have historically delivered subdued returns, and he predicts a flat year for stocks in 2025.

Figure 3: Bull market third-year returns have been the lowest

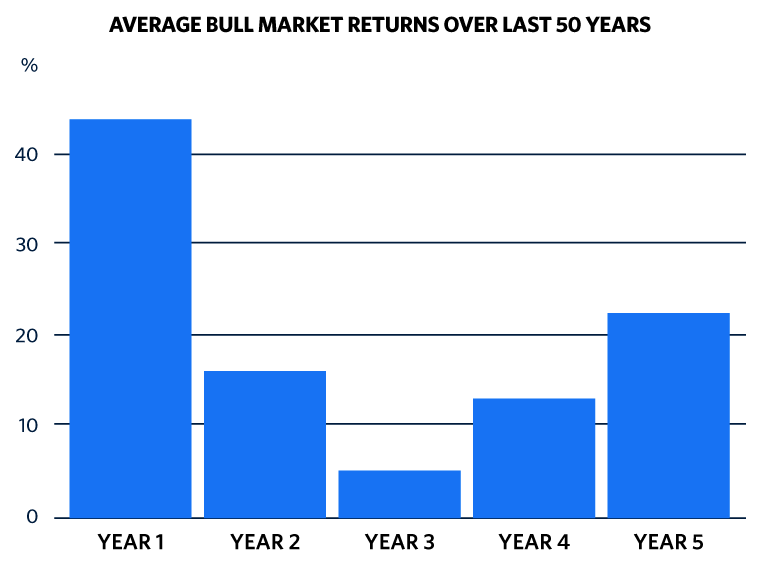
Source: BMO Capital Markets Investment Strategy Group, Factset, Unisuper

He believes markets are expensive without being in bubble territory. The US market is at about a 20% premium on a price-to-earnings ratio basis. Meanwhile, Australia is at a 10% premium.

Where he does see some irrational exuberance is in cryptocurrency. He points out that Dogecoin, now valued at US$40 billion, was set up as a joke by its founders.

He views the broader crypto market as a joke gone too far, and “our members' life savings will not be going anywhere near cryptocurrency investments.”

Figure 4: Cryptocurrencies' irrational exuberance

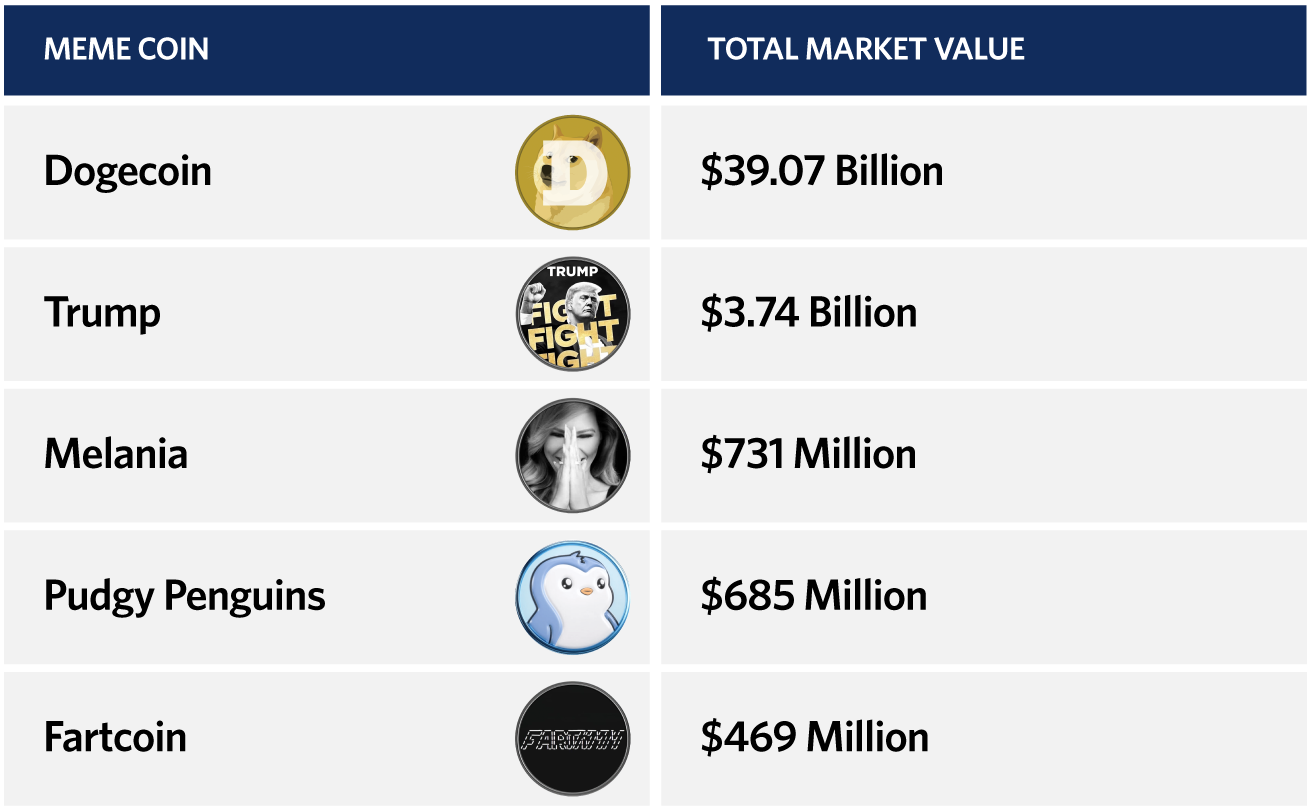
As of 7 February 2025. Source: UniSuper

Pearce says that while he expects a flat year, he won’t discount the possibility of a correction in markets of 10% or more. However, he invests for the long term, and on this basis, he remains optimistic given the growth in the global economy, subdued inflation, strong employment, and the tech revolution:

“… if we do get that correction, UniSuper will be using it as a buying opportunity. We've got plenty of cash, and we intend to load up on assets when the price is right.”

* You can read John Pearce’s full investment update here.
** Disclosure: UniSuper is a Firstlinks sponsor.


James Gruber is Editor of Firstlinks.


22 Comments
Stephen
February 24, 2025

James, you say that "Over a 10-year period, UniSuper’s Balanced and Sustainable Balanced options have handily beaten all the index funds, with annual returns of 7.92% and 7.79% respectively." I think we need a clarification here because there are at least 20 index funds that have exceeded the return of 7.92% pa. Compounded over ten years this is a total return of 114%. Iress shows that over the ten year period to 31 Dec 2024 IVV has returned 300%, SPY 299%, QUAL 287%, VTS 284%, IOO 274%, IJH 201% and so on. cheers

Vonblake
February 24, 2025

Yep. Unisuper appears to only ever report against their CPI+ benchmark rather than actual indices. So you won't know what alpha they actually added. Comparisons of their performance against pure index balanced funds in also not apples with apples given UniSuper $51B default balanced fund is label only. It's equivalent to Growth for other providers given their higher allocation to Aus and International shares.

James Gruber
February 24, 2025

Stephen,

Good question. In their update, UniSuper compared their 'top-quartile' returns over ten years to 'index funds' but didn't specify which index funds they were referring too.

Will endeavour to get the answer.

James

Vonblake
February 21, 2025

Agree John always has a way of simplifying things. Whilst watching tariff is an obvious and direct economic event, Trumps international posturing over Ukraine, NATO, Gaza, WHO and USAID etc also has significant potential to create systemic fractures. Trump 1.O DOHA Agreement is just one obvious example to show just how bad things get when you don't think through the details and work against your supposed allies.

P.S. I'm sure Vanguard could readily correct the statement UniSuper easy beat all Indicies over 10 year period

P.P.S There is 90% chance in any given year there will be at least 10% drawdown. In fact there is greater probability of more than 20% draw down in any given 5 year period

John Abernethy
February 21, 2025

Thanks James

A very good article and thought provoking comments from John Pearce.

Just one point that is often glossed over shown in the following comment on performance -

“Over a 10-year period, UniSuper’s Balanced and Sustainable Balanced options have handily beaten all the index funds, with annual returns of 7.92% and 7.79% respectively.”

If an investor achieves a compound annual return of 6% then over ten years looking back the average return is 8%.

The power of compounding often overstates the actual annual return in the presentation of long term returns.

As Buffett has often stated - the power of compounding is an investors best friend.

SMSF Trustee
February 21, 2025

That's mathematical nonsense John.
Start with $100. Grow by 6% in year 1 that's now $106. Grow that by 6% and it's $112.36 after 2 years. Keep that going for 10 years and it's worth $179.08.
Now calculate the historical return of that: ((179.08/100) ^ (1/10))-1) = 0.06 That's 6% per annum, not 8%.

Compounding is a real thing, but it doesn't inflate returns the way you're claiming.

Ivan
February 22, 2025

The comment that the average is 8% is correct - it's the simple annual average return being referred to. It's just being used as an incorrect reference (ie Unisuper achieved compound annual returns of 7.92, not the implied 6% in the comment).

John Abernethy
February 23, 2025

I don’t see the reference to compound returns in super returns nor in the advertising of returns.

“Over ten years …..annual returns of 7.92% and 7.79% respectively.”

Annual returns are averaged looking back.

Further and let’s be very clear and honest. Compounded returns in pension funds - particularly in pension mode- cannot be quoted or calculated because of outflows ( ie pension payments).

Indeed each pension member will have different returns determined by the annual, monthly or quarterly pension payments made.


Dudley
February 23, 2025

"I don’t see the reference to compound returns in super returns nor in the advertising of returns.":

Random different super vendor:
https://rest.com.au/investments/understanding-investments/investment-returns

"3 standalone years
Year 1 return 3.0%
Year 2 return 12.0%
Year 3 return 1.0%
Annualised over 3 years
3-year annualised return 5.2% per annum
Cumulative over 3 years
3-year cumulative return 16.5%"

Annualised over 3 years:
Average per y;
= AVERAGE(3%, 12%, 1%)
= 5.3333333%

Cumulative over 3 years;
= PRODUCT(1 + 3%, 1 + 12%, 1 + 1%) - 1
= 16.5136%

Compound annualised over 3 years;
= PRODUCT(1 + 3%, 1 + 12%, 1 + 1%) ^ (1 / 3) - 1
= 5.2266006%

Rest example "3-year annualised return 5.2% per annum" is compound not average annual rate.

I would expect the 'rest' of the super vendors to also use compound not average, because average exaggerates.

Linda
February 23, 2025

Looks to me that we have the basis of a future article on or how returns ate calculated and reported.

If contributions and pensions are constantly flowing in and out, franking credits claimed, fees and insurance premiums deducted , fines paid- then the calculation of returns ( including the value of unlisted assets ) looks like a work of art and / or financial construction.

Dudley
February 23, 2025

"Compounded returns in pension funds - particularly in pension mode- cannot be quoted or calculated because of outflows ( ie pension payments)."

Funds in accumulation mode also have outflows.

The compound rate of return can be calculated for both accumulation and disbursement ('pension') funds and individual accounts where outflows have occurred as the 'Internal Rate of Return'.
Example spreadsheet functions: 'IRR(...)' and 'XIRR(...)'.

Proportionally large outflows over a short time period can distort the rate, but consistent outflows less so.

Linda
February 23, 2025

Dudley, your quoted formulas require precise and accurate inputs to derive precise outputs for the real calculation of returns for each individual super fund member.

You haven’t shown as to how those precise inputs - which occur daily if not hourly - are able to be collated for every member receives their individually calculated return.

It is financial engineering that serves a purpose, but it is important to maintain confidence in the system by not openly disclosing the extent to which calculations are based on assumptions and not facts.

SMSF Trustee
February 23, 2025

John again I have to correct you. Super fund returns are calculated using fund value calculations that allow for inflows and outflows to generate the outcome for a constant initial investment that's reinvested. That is, it's the return of the underlying investment portfolio.
Of course for every individual who makes contributions over time - and makes withdrawals - that number won't fully reflect their personal results perfectly. But as a measure of the super fund's performance from point to point its accurate and valid.

Dudley
February 24, 2025

Linda,

"how those precise inputs - which occur daily if not hourly - are able to be collated for every member receives their individually calculated return":

Can not post files or images here so description must suffice.

Spreadsheet columns: Date, Invest, Withdraw, Return, Net
on each row, Net = sum(Date, Invest, Withdraw, Return)
First row in column Invest must be an amount invested - must be negative (out of hand into fund)
Withdraw and Return amounts must be positive.
Last row Withdraw must be fund / account balance - positive.
Calculate =XIRR(Net, Date)
Google Excel XIRR

As you say must be precise with presentation of inputs.

John Abernethy
February 24, 2025

SMSF Trustee

If you are correctly describing yourself and you are a SMSF Trustee, for one or two members, then I am sure that you could probably work out your returns - but they would still be an estimate.

As for Industry and Retail Super Funds - which you seem keen to support - with their one million odd members - pension and accumulation - the returns are constructed from a range of estimates, with assumptions ,with reserving, with the sharing of franking credits, and with unlisted valuations

Do you have specific ( industry) knowledge to the contrary and what is your source?

Dudley
February 24, 2025

"on each row, Net = sum(Date, Invest, Withdraw, Return)":
err;
on each row, Net = sum(Invest, Withdraw, Return)

Linda
February 24, 2025

Dudley

Just 4 inputs ( for example) which individually will affect the calculation of daily returns.

Describe how the formula works

1. Unlisted asset valuations.
2. Franking credits ( finalised at end of financial year).
3. Accumulation tax (15%) and nil tax for pension funds - finalised at end of financial year; and
4. Currency movements - hedged and unhedged - changes all the time


Cheers

Dudley
February 24, 2025

Linda, "Just 4 inputs ( for example) which individually will affect the calculation of daily returns.":

The account owner 'takes what is given or takes their money'.
To get their IRR based on daily balances:
At first date, value = -AccountBalanceAtThatDate.
Between dates, value = (+AccountBalanceAtThatDate - AccountBalanceAtDayBefore).
At last date, value = +AccountBalanceAtThatDate.
= XIRR(Values, Dates)

The considerate fund manager will try to apportion non-daily changes on fund returns, such as franking credits and revaluations, to each account daily.
They may know the franking rate as it may be declared by company at each dividend declaration.
Not perfect but does not change the IRR much for account owners over the longer term who make few or small investments or withdrawals.

Linda
February 25, 2025

Dudley

“The considerate fund manager will try to apportion non-daily changes on fund returns, such as franking credits and revaluations, to each account daily.”

I rest my case

Dudley
February 25, 2025

Linda, "I rest my case":

It'sa nota so bad.

10% at end of year:
Date Value
1/01/2021 -1
1/01/2022 1.1
XIRR 10.00%

10% over a year:
Date Value [ daily =(1 + 10%) ^ (1/365) - 1 ]
1/01/2021 -1
2/01/2021 0.000261158
3/01/2021 0.000261158
...
29/12/2021 0.000261158
30/12/2021 0.000261158
31/12/2021 1.000261158
XIRR 10.00%

SMSF Trustee
February 27, 2025

John A, you asked me: Do you have specific ( industry) knowledge to the contrary and what is your source?

Yes, I do. I worked for 40 years in the industry, including with a major funds manager. I tracked fund returns daily and spent a lot of time understanding how the fund accountants did the calculations of unit prices, fund values and fund returns.

The point you are missing in this whole discussion is that when John Pearce or anyone from a super fund says, 'our fund returned X% over Y years' they are not saying that every individual investor who came into the fund, made extra contributions or withdrew funds for whatever reason, made X% over Y years. They are saying that the fund in which people came into and went out of made that return.

You are criticising them for providing a common point of comparison, both across their own different fund styles as well as with other fund managers, on the underlying portfolio. It's a measure of their management skill. This is a perfectly valid and important piece of information. But it's never put forward as an individual's personal return. That's why I've reacted to your criticism - because it's a straw man argument.

As for my SMSF returns, yes they are calculated by my administration provider based upon my own actions within the fund. Let's say I had 100% on day 1 in an asset that earned 10% over 5 years, then 20% for 5 years to get around 15% pa over 10 years. (That's a very very rough approximation.) But if I sold that asset after 5 years and invested in something that made 10% pa over the next 5 years, then my fund return is going to be 10% because it will allow for the change in asset and returns on the assets held. I didn't earn the 20% pa on the first asset because I sold out of it before it's return accelerated.

But that doesn't mean that the first asset didn't earn 15% pa over 10 years, just because I personally didn't own it for the back half of the period. Which is what you are in effect trying to claim is the falsehood in super fund returns not taking individuals into account. Of course a UniSuper investor who pulled money out ahead of the better years or put money in ahead of the worse years within the last 10 won't have earned the 8% that the fund earned. But so what? That doesn't mean that UniSuper didn't earn 8% pa, just that the individual wasn't fully invested in that fund for that period of time.

The industry has standards that all funds must adhere to. Asset consultants and others check performance numbers all the time. Your criticism is simply not valid.

Bill Jauncey
February 21, 2025

An excellent article. All makes good sense backed by reliable stats.


Leave a Comment:

RELATED ARTICLES

A reluctant investor’s guide to understanding bitcoin

How can you not be bullish the US?

9 lessons from 2024

banner

Most viewed in recent weeks

16 ASX stocks to buy and hold forever, updated

This time last year, I highlighted 16 ASX stocks that investors could own indefinitely. One year on, I look at whether there should be any changes to the list of stocks as well as which companies are worth buying now. 

UniSuper’s boss flags a potential correction ahead

The CIO of Australia’s fourth largest super fund by assets, John Pearce, suggests the odds favour a flat year for markets, with the possibility of a correction of 10% or more. However, he’ll use any dip as a buying opportunity.

2025-26 super thresholds – key changes and implications

The ABS recently released figures which are used to determine key superannuation rates and thresholds that will apply from 1 July 2025. This outlines the rates and thresholds that are changing and those that aren’t.  

Is Gen X ready for retirement?

With the arrival of the new year, the first members of ‘Generation X’ turned 60, marking the start of the MTV generation’s collective journey towards retirement. Are Gen Xers and our retirement system ready for the transition?

Why the $5.4 trillion wealth transfer is a generational tragedy

The intergenerational wealth transfer, largely driven by a housing boom, exacerbates economic inequality, stifles productivity, and impedes social mobility. Solutions lie in addressing the housing problem, not taxing wealth.

What Warren Buffett isn’t saying speaks volumes

Warren Buffett's annual shareholder letter has been fixture for avid investors for decades. In his latest letter, Buffett is reticent on many key topics, but his actions rather than words are sending clear signals to investors.

Latest Updates

Investing

Finding the best income-yielding assets

With fixed term deposit rates declining and bank hybrids being phased out, what are the best options for investors seeking income? This goes through the choices, and the opportunities and risks involved.

Shares

What history reveals about market corrections and crashes

The S&P 500's recent correction raises concerns about a bear market. History shows corrections are driven by high rates, unemployment, or global shocks, and that there's reason for optimism for nervous investors today. 

Shares

The ASX is full of old, stodgy, low-growth companies

Eight of the ASX's top 10 stocks are more than a hundred years old, while in the US there's just one. It points to our market being filled with low-growth dinosaurs compared to the US where innovation and renewal rule.

Retirement

Time to review the family home's exemption from Age Pension test

Improving housing mobility in Australia is crucial for enhancing both individual well-being and the economy. Potential reforms include ensuring greater rental security and incentivising downsizing among older homeowners.

Superannuation

Death benefits from super don't need to be this complicated

This may surprise you, but a person's super balance does not automatically form part of their estate. A simple change could bring greater certainty to Australians, quicker payouts for families, and lower super fees.

Economy

The RBA deserves kudos for a job well done

Over the past few years, the Reserve Bank of Australia has been subjected to a blizzard of criticism. Yet, despite its flaws, it may just have engineered that rarest of beasts: the fabled soft economic landing.

Investing

Asia deserves a closer look from investors

As part of their global exposure, Australian investors typically allocate most to Developed Markets equities, and a smaller portion to Emerging Markets. This looks at the latter position and whether there might be a better way.

Sponsors

Alliances

© 2025 Morningstar, Inc. All rights reserved.

Disclaimer
The data, research and opinions provided here are for information purposes; are not an offer to buy or sell a security; and are not warranted to be correct, complete or accurate. Morningstar, its affiliates, and third-party content providers are not responsible for any investment decisions, damages or losses resulting from, or related to, the data and analyses or their use. To the extent any content is general advice, it has been prepared for clients of Morningstar Australasia Pty Ltd (ABN: 95 090 665 544, AFSL: 240892), without reference to your financial objectives, situation or needs. For more information refer to our Financial Services Guide. You should consider the advice in light of these matters and if applicable, the relevant Product Disclosure Statement before making any decision to invest. Past performance does not necessarily indicate a financial product’s future performance. To obtain advice tailored to your situation, contact a professional financial adviser. Articles are current as at date of publication.
This website contains information and opinions provided by third parties. Inclusion of this information does not necessarily represent Morningstar’s positions, strategies or opinions and should not be considered an endorsement by Morningstar.