The Weekend Edition includes a market update plus Morningstar adds links to two additional articles.
Among many behavioural tendencies that impair decisions is confirmation bias, where we interpret and look for information that is consistent with our preferences or beliefs. It may prevent opposing views entering deliberations. A property fund manager will find data which shows rentals rising and high occupancy rates. A fixed interest bond manager will read commentary to justify lower interest rates and falling defaults. A private equity manager will point to the volatility of listed equities and better values of private assets. And so on.
The theory is that there are three types of confirmation bias: selective search, selective interpretation and selective recall. Politicians use all three, as well as simply choosing facts to suit an argument. Treasurer Jim Chalmers is finding data points to justify the new tax on super balances over $3 million that are irrelevant to that threshold. This week, Chalmers introduced a short consultation period on the Exposure Draft.
In announcing the legislation, Chalmers previously said:
"The average superannuation balance is about $150,000 and the few people with balances above $3 million hold an average of almost $6 million in their accounts. As the Prime Minister said, 17 people have gotten over $100 million and one person's got over $400 million. And think about this example: a $100 million fund earning a 5% return receives a tax break upwards of one and a half million dollars a year compared to a return outside of superannuation taxed at the marginal rate. So it takes 100 average wage earners paying the average amount of tax to pay the tax break for that single super account every year."
Let's consider the selective bias in this statement:
1. The new tax is on balances over $3 million so quoting the impact of a few people over $100 million and one over $400 million is hyperbole.
2. Measuring the impact against marginal tax rates disregards how people will respond. They will not withdraw from super to pay tax at 45%. They will either leave money in super and pay the extra 15% tax or use another investment structure such as a company, or even buy a bigger home and pay no tax.
3. The '17 people hold over $100 million' is a great headline but for all the effort and compliance work involved, the tax will raise only $2 billion a year, even assuming no change in behaviour. It's hardly meaningful tax reform although the Treasurer likes to call it that. In the Tax Expenditure & Insights Statement, Capital Gains Tax (CGT) exemptions total $72 billion and the family home exemption alone is worth $48 billion. Where are the stories about people with homes worth over $10 million making tax-free capital gains? No way, sacred cow.
4. Chalmers is ignoring the main objection to the tax. It is not so much the amount but the way it imposed, taxing unrealised capital gains. Most people in the industry accept the need to cap super benefits but this calculation method is a radical departure from normal tax policy and introduces anomalies.
***
Misinformation comes in many forms. There is so much misleading information in the media that it's difficult to know what to believe, as we cannot be expert in most subjects. As Morgan Housel wrote recently:
"Most fields have only a few laws. Lots of theories, hunches, observations, ideas, trends, and rules. But laws – things that are always true, all the time – are rare ... The strongest-held beliefs are usually on topics with the most uncertainty. No one is as passionate about geometry as they are about religion."
Australia's Department of Home Affairs has established a 'Strengthening Democracy Taskforce' because, they say, our democracy is a national asset that should be protected.
"Democracies around the world are under threat from a range of anti-democratising forces, including foreign interference, rising disinformation and discord online, populism and polarisation, and declining reserves of public trust."
General Angus Campbell, Chief of the Australian Defence Force, recently told the Australian Strategic Policy Institute that:
“This tech future may accelerate truth decay, greatly challenging the quality of what we call public ‘common sense’, seriously damaging public confidence in elected officials and undermining the trust that binds us.”
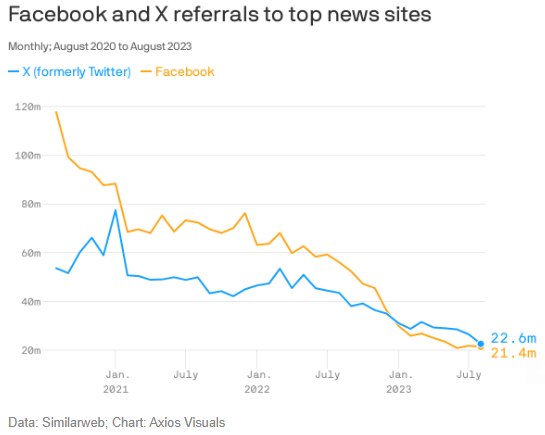
Social media platforms X (formerly Twitter) and Facebook are withdrawing from news content and focussing more on entertainment and viral trends. The chart below shows how traffic referrals to news sites have slumped. It compromises the ability of voters to receive accurate information as fewer people can source reliable news on social media platforms.
Consider a social issue regularly in the news, the problem of rising inequality, and some recently-released charts on Australia. Most people accept that rich people should pay proportionally more tax than poor people, but what's the right level? The Australian Taxation Office reports:
* At the bottom end, 43.8% of adults pay 3.2% of net tax.
* At the top end, 11.7% of adults pay 55.3% of net tax, of which 4.1% pay 35.4%.
If asked the question, how much of net tax should the Top 10% of income earnings pay, how many people would say much more than 50%?
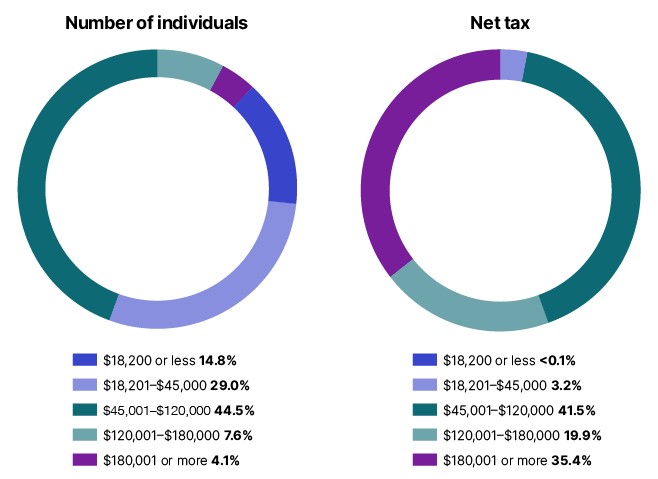
So that's one picture of tax addressing inequality.
Then last week, the Australian Council of Social Service (ACOSS) and University of NSW, as part of its Poverty and Inequality Partnership, produced an Inequality in Australia 2023 Overview. It paints a picture less of the wealthy supporting the poor but more like a country where the rich get richer.
"Australia’s wealth gap has continued to grow over the past two decades, with superannuation and property investment driving inequality across the country."
Here are three slides from the Report.
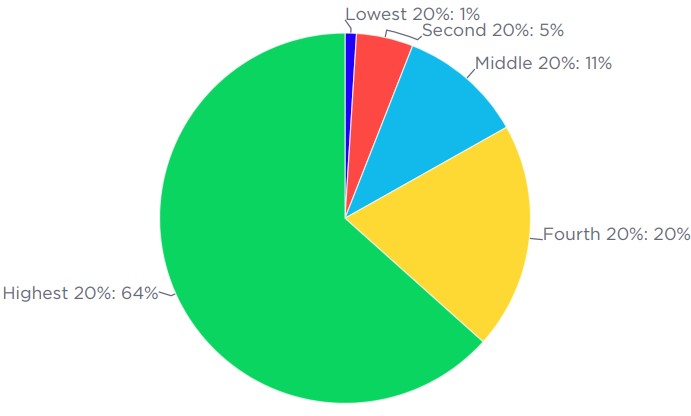
First, the share of all wealth held by each wealth group divided into quintiles. The top 20% holds 64% of wealth, while the bottom 40% holds about 6%.
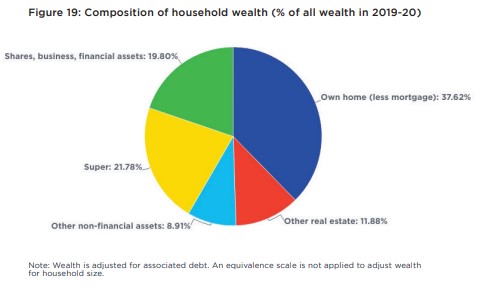
Second, the two largest components of household wealth are own home (net of mortgage) at 38% and superannuation (22%). Australia is a country where home ownership and superannuation primarily determines where someone stands in the wealth stakes.
Third, between 1999 and 2019, the wealthiest 5% experienced the largest percentage increases in after-tax income, despite what the ATO tax tables show. But the lowest 40% increased their after-tax income by the same percentage as the highest 20%, and it is in the middle tiers - from 41% to 80% - that have experienced the smallest increases.

As the ACOSS/UNSW Report says,
"Since wealth begets more wealth, wealth inequality rises more persistently than inequality of income."
My overall conclusion from the Report is that inequality increases when asset prices rise fastest, and with most wealth in houses and super, inequality rose in the period to 2007 before the GFC, and probably since 2019 with equity and property markets doing well. Our surging property market and strong jobs markets are the main reasons Australians in general are among the wealthiest people in the world. For the main part, whether Australia looks like it is moving to become a more or less egalitarian society reflects market values of assets.
Over the long term, expect superannuation and residential property to perform well and become more of a target for governments seeking to address budget deficits and inequality. Confirmation bias will continue to justify policy decisions.
This week, David Knox runs the numbers on whether government revenues are worse due to superannuation benefits, or do the savings in the Age Pension justify the tax breaks. We can be sure we have not seen the end of superannuation changes even if Treasurer Chalmers says the $3 million tax is the only one for this term of government.
***
Which all makes the Stage 3 tax cuts an even bigger political issue, although discussion has dropped away in recent months. They are legislated to begin on 1 July 2024, now only nine months away, and taxpayers in the $45,000 to $200,000 bracket will pay a marginal tax rate of 30%. Economist Chris Richardson estimates they are the economic equivalent of three interest rate cuts, suggesting this will temper any official reductions in cash rates. The best guess from here is a cash rate at around the current level for at least 18 months.
ASX 30 Day Interbank Cash Rate Futures Implied Yield Curve (as at 28 Sept 2023)
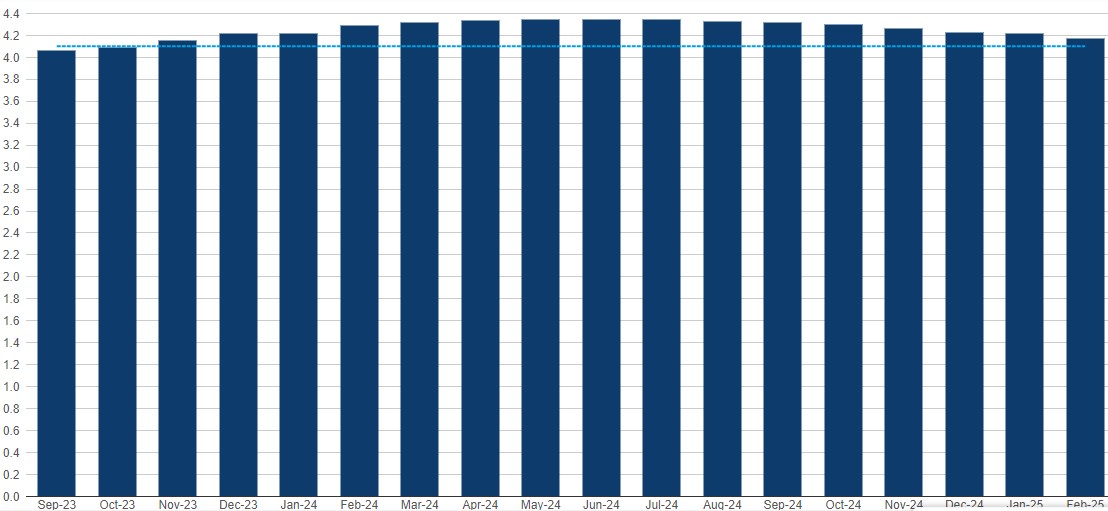
There has been a change in market sentiment in the last month or so, now believing inflation will remain elevated with the robust economy preventing rate falls. Oil prices are higher than expected and the new Reserve Bank Governor, Michele Bullock, is already warning about further rate increases.
The S&P/ASX200 is close to a one-year low and bond yields are at a 10-year high as we move into the last quarter of calendar 2023. September 2023 gave away earlier modest gains in Australia and the index is down another 2.5% in October to date. If you feel your portfolio has gone nowhere, combined with losses in bond funds, you're not alone. Those with more US exposure, especially to tech, have done better, but have also given some back recently.

(Chart source, OwenAnalytics)
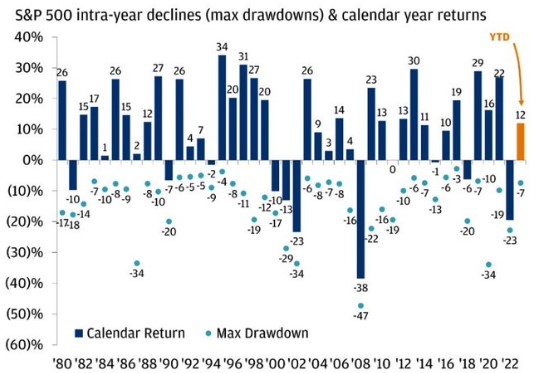
The challenge for investors is realising that every year, regardless of how well they perform overall, stockmarkets have a solid drawdown (market loss) at some stage of the year, as shown below for the S&P500 index. If there is a company that an investor wants to own, this period can deliver a cheaper opportunity.
For those seeking the safety of long bonds, watch out for duration risk. The rise in interest rates now means that the Vanguard Extended Duration Treasury ETF in the US has now experienced a larger drawdown than the S&P500 index during the GFC.
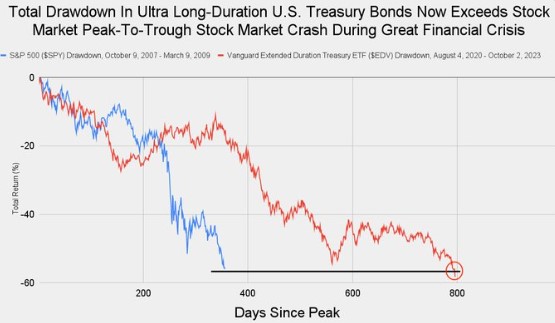
Source: Jack Farley
***
The ATO has issued a special notice to taxpayers about CGT on rental property, shares and crypto assets, saying they are seeing many mistakes in tax returns, including using a family home for income. Assistant Commissioner Tim Loh said the ATO receives reports on over 600 million transactions a year, including from property titles offices, revenue agencies, exchanges and share registries. He said:
"Generally, your main residence (your home) is exempt from CGT, but if you’ve used it to produce income, such as renting out all or part of it, including through the sharing economy, like through Airbnb or Stayz, or running a business from home, then you may have to pay CGT ... If you think you can slide under the radar and avoid reporting a capital gain, think again."
***
In my article this week, I look at how SMSF trustees invest based on three different data sources, then dive deeper into the most popular listed companies, managed funds and ETFs used by SMSFs. There remains a local bias, as most trustees make their own investment decisions based on what they know and understand.
Graham Hand
Also in this week's edition...
Bonds look set for their third straight year of losses, something that hasn't happened over the last 100 years. James Gruber analyses what's behind the carnage in bond markets and asks whether this is the start of a generational bond bear market.
More Australians are investing overseas and recent data suggests many are choosing to hedge their international exposure. Vanguard's Duncan Burns investigates whether hedging is worth the cost, and if so, which investors it may suit best.
Another episode of the Wealth of Experience podcast is out and this week features special guest, personal finance guru Noel Whittaker. Noel offers his key tips for making the most of your retirement. He discusses the mistakes that people make with SMSFs, why super remains a good vehicle for retirees, how estate planning is a 'minefield', and the financial traps to avoid with aged care. Graham looks at LICs and Peter checks in on bonds.
Fidelity's James Abela compares mid-cap stocks to a middle child: both tend to be overlooked and underappreciated. He explains why mid caps offer potentially more growth than large caps and less risk and volatility than small and micro-caps.
Clime's Will Riggall says while bond yields are more attractive than they were a year or two ago, they're still not high enough to compensate for the risks of persistent inflation. Will suggests equities offer the best prospects for income oriented investors.
Two extra articles from Morningstar for the weekend. An ASX stock is added to the global best ideas list, while Jon Mills raises coal stock fair values due to increased coal price forecasts.
Lastly, in this week's White Paper, Franklin Templeton explains why it no longer expects a technical recession in the US and that central banks will keep interest rates higher for longer.
***
Weekend market update
On Friday in the US, stocks shook off early losses finishing higher after investors digested the latest jobs report. The Nasdaq was up 1.6%, while the S&P 500 added 1.2% and he Dow rose 0.9%. The 10-year Treasury yield surpassed its highest level of the year, surging to 4.858% after the jobs report, the highest since July 2007, before settling at 4.783%. Brent crude oil fell again, by 0.6% to US$84.58 a barrel.
From AAP Netdesk:
The local share market on Friday finished higher ahead of the US jobs report.
The benchmark S&P/ASX200 index closed up 28.7 points, or 0.41%, to 6,954.2, while the broader All Ordinaries added 25.5 points, or 0.36%, to 7,143.0.
For the week the ASX200 fell 1.3% in its third straight week of losses. It's also down 1.2% for the year after closing at an 11-month low on Wednesday, and 6.9 per cent from its highs of late July.
On Friday the ASX's 11 official sectors closed mixed, with four higher and seven lower.
The financial sector was the biggest mover, gaining 1.2% as all the Big Four banks finished in the green. Westpac added 2.1% to $21.44, NAB rose 1.5% to $28.94, CBA gained 1.1% to $100.04 and ANZ added 0.9% to $25.32.
But Magellan Financial Group was the worst loser in the ASX200, plunging 18.5% to a decade low of $7.69 after the investment manager disclosed it experienced net outflows in September of $2 billion.
GQG Partners in contrast rose 3% to $1.36 after reporting its funds under management grew $US1.8 billion in the September quarter, to US$105.8 billion.
In the heavyweight mining sector, Rio Tinto added 1.1% to $113.19, BHP climbed 1.2% to $43.97 and Fortescue Metals gained 1.4% to $21.06.
Lithium miners Allkem and Pilbara fell to six-month lows - dropping 2.9% to $10.69 and 0.8% to $3.91, respectively - amid a drop in demand for the battery metal on the back of the US autoworkers strike. Nickel, copper and lithium miner IGO fell 4.4% to a more than one-year low of $11.06.
From Shane Oliver, AMP:
- Global share markets were mixed over the last week. US shares initially fell as higher bond yields continued to pressure valuations not helped by political uncertainty with the replacement of the House Speaker, but then rebounded from technical support on Friday helped by a “goldilocks” (not too strong, not too weak) interpretation of the latest jobs data. This saw US shares rise 0.5% for the week. Eurozone shares fell 1.2% for the week and Japanese shares fell 2.7%. The poor global lead saw Australian shares remain under pressure despite the RBA leaving interest rates on hold with the ASX 200 falling 1.3% for the week. From their July highs to their recent lows US & Australian shares have had a fall of around 8%. Bond yields rose further. Oil prices fell sharply on concerns about slowing demand and metal and iron ore prices also fell. The $A fell, reaching an 11-month low, with the $US flat.
- We continue to see the RBA leaving rates on hold ahead of rate cuts next year, but with a 40% chance of a final rate hike by year end. As widely expected, the RBA left rates on hold following its latest board meeting with new Governor Michele Bullock making little change to the post meeting statement. With inflation still high the RBA understandably retained a tightening bias indicating that the risk of a further increase in interest rates remains high and poor productivity, signs of a pickup in wages growth, the rise in petrol prices and the fall in the $A reinforce this. So we are allowing for a 40% chance of another hike with the November meeting (after quarterly CPI data and revised RBA forecasts) and the December meeting (after quarterly wages data) being the ones to watch. However, if as we expect the economy continues to weaken as past rate hikes increasingly bite this will maintain downwards pressure on inflation heading off any further rate hikes and ultimately allowing the RBA to cut rates next year, starting around June.
- But won’t the rise in petrol prices and the fall in the $A force the RBA to hike? While both may concern the RBA its more complicated than commonly thought. First, the rise in petrol prices is occurring against a very different background than was the case 18 months ago. Then many commodities and prices were up with supply shortfalls, people wore it as they were happy to be free from lockdowns and monetary policy was easy. Now many other commodity prices are down, goods prices have generally weakened, reopening euphoria has long faded and monetary policy is tight which has hit households. So, while higher petrol prices add directly to inflation the flow on will be limited or negative as its more likely to act as a tax on spending. Second, in relation to the fall in the $A it hasn’t fallen enough yet to be a major problem, the pass through of changes in the $A to consumer prices has not been as strong in recent times and while the lower $A partly reflects Australian rates being below those in the US it also reflects “risk off” sentiment amongst global investors and is a sign of concern about the outlook for commodity prices and global growth which is potentially deflationary, not inflationary. So the RBA shouldn’t be rushing into another rate hike just because of higher petrol prices and the lower $A.
Curated by James Gruber and Leisa Bell
Firstlinks welcomes a new sponsor, UniSuper, and we will regularly feature their short videos and podcasts.
Latest UniSuper Podcast
Latest updates
PDF version of Firstlinks Newsletter
ASX Listed Bond and Hybrid rate sheet from NAB/nabtrade
Updates and announcements on the Sponsor Noticeboard on our website