The Weekend Edition includes a market update plus Morningstar adds links to two additional articles.
I love looking back through history as it can provide context to the present, and perhaps a glimpse into the future.
Records of financial history in Australia are generally poor. However, I recently stumbled across data from the now defunct database of the Australian Centre for Financial Studies. It shows the top 10 listed companies in Australia dating back almost 80 years.
Here are the top 10 stocks in 1948.
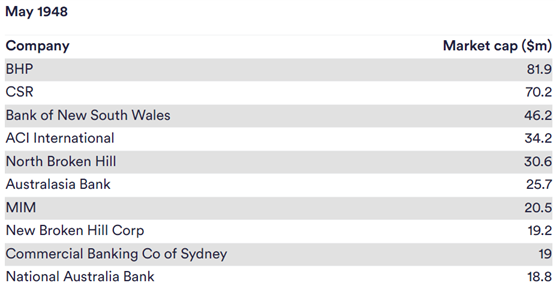
The largest ASX stock today, BHP, was the number one by market capitalisation back then too. CSR was a giant sugar company in 1948 and its star has faded since. Meanwhile, there were plenty of banks on the list, which would later merge, or get acquired, to form bigger companies. Likewise for the miners. I hadn’t heard of ACI International, though apparently it was a manufacturer of bottles and glassware until eventually closing in 1982.
Notice that nine of the top 10 companies back then were in banking and resources.
Let’s go forward a decade to the top 10 companies in 1958.
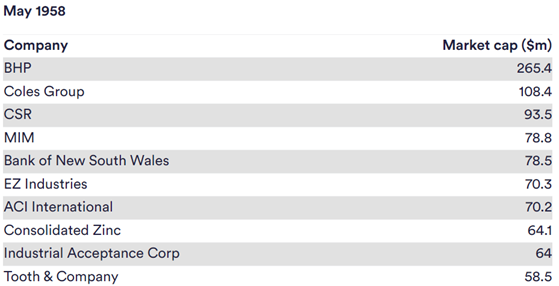
BHP made big gains during the 1950s. Coles had its first appearance as the second largest stock on the exchange. EZ Industries was a zinc miner and refiner that closed in 1984. Industrial Acceptance Corp later became a subsidiary to US banking giant, Citi. The brewer, Tooth and Company, was eventually delisted in 2010.
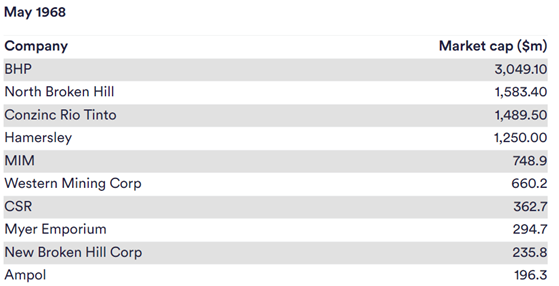
A decade later, the market caps of the miners exploded as the 1960s witnessed a commodities mania. Myer made its appearance in the top 10, as did Ampol.
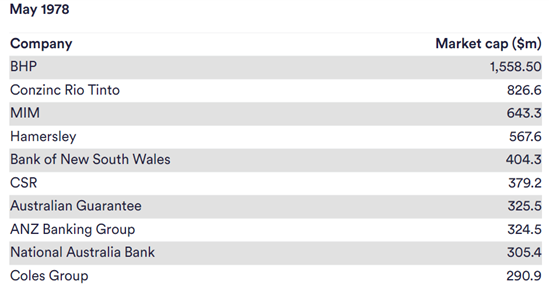
By 1978, you can see that the market caps of the miners had shrunk considerably after the 1960s mining boom deflated. ANZ made its first appearance in the top 10 after merging with ES&A Bank in 1970. And Coles snuck back onto the list.
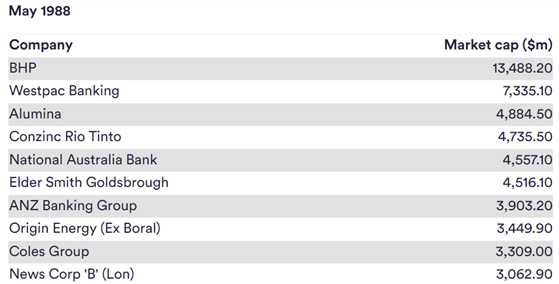
By 1988, BHP had a massive decade, growing to be almost twice as big as second placed Westpac. All of the top 10 then had market caps in the billions of dollars. And Elders, Origin, News Corp, and Alumina appeared on the list.
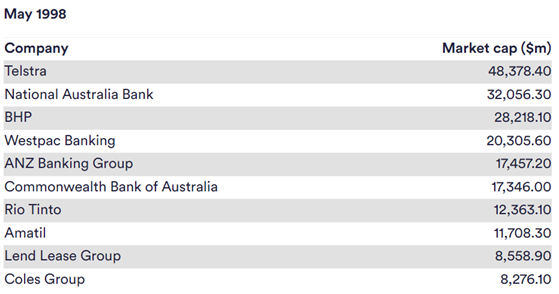
Wow – by 1998, Telstra was number one, thanks to the Internet boom. NAB leaped into second spot after a string of acquisitions, though that all came undone a few years later. BHP dropped to third place. Yet, it’s apparent by now that the banks and miners have bulked up through acquisitions to consolidate and become much bigger entities. Meanwhile, Amatil and Lend Lease entered the top 10.
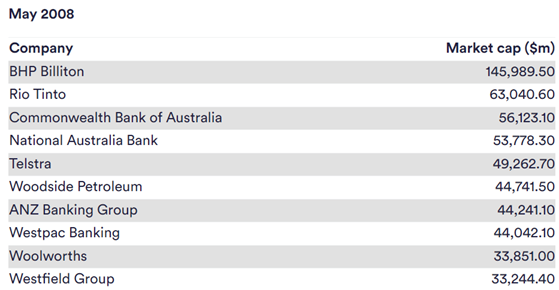
A decade later, and just before the GFC, BHP regained first place. China’s entry into the WTO in 2001 and subsequent rise sparked a commodities bull market for the ages, and BHP and Rio were key beneficiaries. Consolidation took place in the banking sector though the banks would run into a wall months after this as the world’s financial system teetered. Telstra dropped from first place to fifth as the Internet mania faded and the business had poor management at the helm.
Westfield made the list for the first time after Frank Lowy worked his magic and Australia enjoyed a property bonanza.
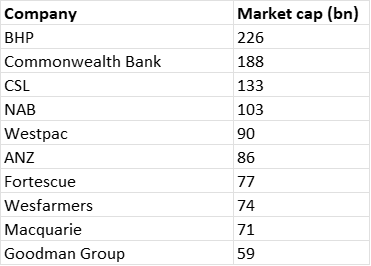
Let’s fast forward more than 15 years to the top 10 stocks on the ASX today.
Source: Morningstar
The makeup of the top 10 looks quite different today. Healthcare giant, CSL, is the third largest ASX stocks. Fortescue has grown rapidly to the sixth largest sock. Wesfarmers makes its first appearance, as does industrial property behemoth, Goodman Group.
All up, the different lists show the rise and fall of different industries. Once, manufacturing and agriculture were prominent, but no more. Recently, healthcare and services including retail have become more important.
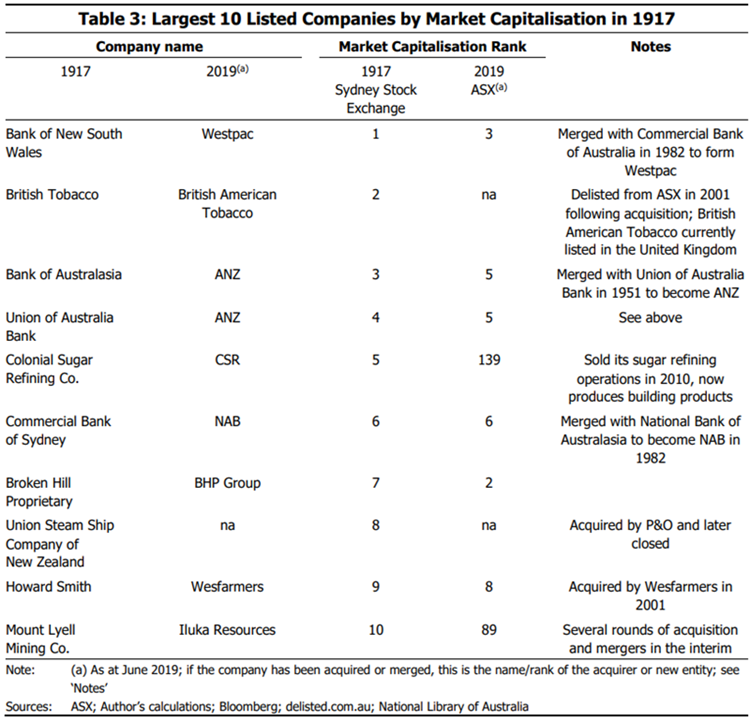
The lists also reveal that many of the top companies haven’t disappeared – they either merged or were acquired. This is confirmed by an RBA study in 2019 which shows that 6 of the top 10 companies back in 1917 are still around today, albeit under different guises.
How concentrated is our market versus history?
There’s been a lot of market talk about how concentrated the S&P 500 has become, with the top 10 stocks accounting for around 33% of the index.
In Australia, the concentration has always been greater.
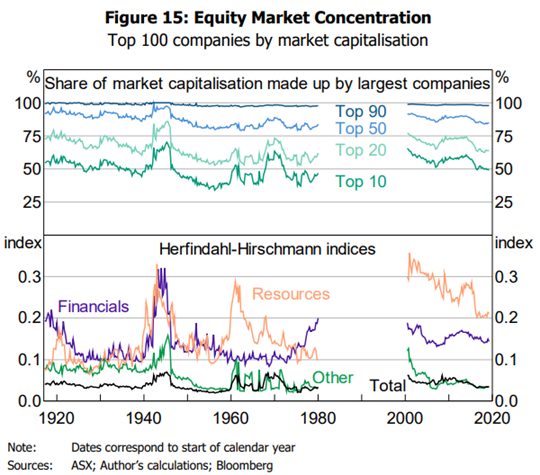
The RBA chart above shows that the top 10 stocks were almost 75% of the total exchange market capitalization in the 1940s. And they’ve also been as low as the early-to-mid 30% range. Today, the top 10 account for close to 47% of the total market cap, which is the lowest in several decades.
Sector breakdown through history
We all know that banks and miners play a big part in our market, though how much influence do they have versus history?
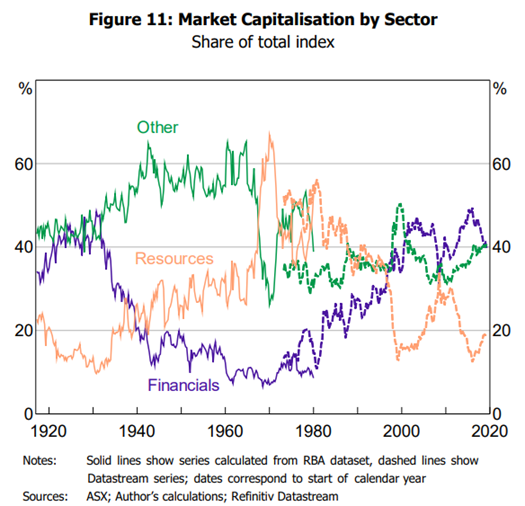
The RBA study mentioned above has this chart. Note that it references market capitalization by sector rather than the more common market weighting by sector (which is different). Nevertheless, it shows that resources were once 65% of the index, and that’s declined to close to 20%. Meantime, financials are back close to 40%, where they were back in the 1920s, though they subsequently fell to single digits in the 60s’ when mining stocks went ballistic.
You’ll see that the ‘other’ category is ticking up again, and that’s mostly composed of industrials, which include healthcare, retail, infrastructure, and so on. These sectors seem to have tailwinds that suggest they’ll become an even greater part of the index in future and reduce our concentration in the banks and miners.
***
In my article this week, I provide a sequel to my previous article, 16 ASX stocks to buy and hold forever. This time, I look at the best US stocks to own indefinitely. The list includes well-known companies such as Microsoft, Coca-Cola, and Visa, but also lesser lights like Northrop Grumman, Fair Isaac, and Union Pacific.
James Gruber
Also in this week’s edition…
Dimitri Burshtein has a ripping story on how the $3 million super tax ensnares retired, and soon to retire, public servants and politicians who are members of defined benefit superannuation schemes. They’re not happy about it and are furiously lobbying for exemptions from the new tax.
Michael Matusik writes of how baby boomers will account for a third of population growth between 2024 and 2029, making this generation the biggest age-related growth sector over this period. And this means that boomers will shape the property market with their unique needs.
Meg Heffron is back to look at what a surviving spouse must think about when a member of an SMSF dies. A little morbid, I know, yet it pays to know what needs to be done immediately, and later on. Meg gives a guide on all that you need to know.
Small cap stocks have only just started to outperform their larger counterparts, after trailing for the best part of 15 years. Roger Montgomery says he was early with his call in May last year for small caps to outperform, yet he believes the investment case has only strengthened since then.
Paul Tilley returns with Part 2 of his series on the mixed fortunes of Australia’s tax reform efforts since Federation. Last week, he detailed the history of the tax system and the issues it now confronts. This week, Paul looks at Australia’s main tax reviews and examines the key ingredients that make a tax reform exercise work, or not.
What impact will AI have on investing? RQI Investors’ Dr. David Walsh outlines how investors, advisors and investment managers can better prepare to manage the opportunities and risks that come with AI.
Two extra articles from Morningstar for the weekend. Mark LaMonica writes on four cheap wide moat ASX stocks, while Mark Taylor analyses results from Santos.
Lastly, in this week’s whitepaper, Franklin Templeton investigates what the last mile of inflation will look like, and the implications for fixed income.
***
Weekend market update
On Friday in the US, stocks ended mostly lower, with the S&P 500 posting a third straight week of losses as tech stocks slumped.
The S&P 500 closed 0.9% lower on Friday, while the tech-heavy Nasdaq Composite dropped around 2%, while the Dow Jones Industrial Average rose 0.6%.
For the week, the S&P 500 dropped 3.1%, the Nasdaq sank 5.5% and the Dow finished about flat. The Nasdaq logged a fourth straight week of losses in its longest losing streak since December 2022.
Brent crude oil ended below the day's highs as panic eased over Israel's retaliation against Iran, finishing up 0.2% to US$87.29 a barrel while gold was similarly up 0.2% to reach US$2,403 an ounce.
From AAP Netdesk:
The local share market on Friday slumped to its lowest level since February as the spectre of a broader Middle East conflict spooks investors. The benchmark S&P/ASX200 index on Friday finished down 74.8 points, or 0.98%, to 7,567.3, a weekly loss of 2.8%. The broader All Ordinaries fell 81.5 points, or 1.03%, to 7,817.4.
Every official ASX sector finished in the red, with energy stocks the least affected. The sector edged 0.1% lower, buoyed by the rising oil price.
Woodside suffered a 31% drop in revenue for the first quarter compared to the prior corresponding period, but chief executive Meg O'Neill was encouraged by progress on the oil and gas producer's three major growth projects. Shares in Woodside finished 0.2% lower after being up earlier in a day of whipsaw trading, while fellow fossil fuel giant Santos was 1.8% higher. Karoon Energy fell 5.4% after downgrading its production outlook for 2024 due to lower forecasts at its Who Dat field in the Gulf of Mexico. The Melbourne-based company recorded a 6% quarter-on-quarter drop in first quarter sales revenue.
Miners more than reversed previous day's gains, with the sector falling 1.1%. Iron ore heavyweights BHP and Rio Tinto both sank 1% while Fortescue Metals dropped 2%. Goldminers profited from the increased risk atmosphere as spot prices in the yellow metal built on already record highs. Evolution Mining climbed 1.8% to $4.07 while Northern Star firmed 1.3%.
The Big Four banks were all in the red. CBA slipped 0.8%, Westpac fell 0.9%, ANZ dropped 1.1% and NAB finished 1.2% lower.
Interest rate-sensitive tech stocks were the index's worst performing, down 1.6% as a sector. Logistics software provider WiseTech slumped 2.5% and accounting software company Xero was 1.2% lower.
From Shane Oliver, AMP:
- Fed rate cut delays remain a key focus for markets. Fed Chair Powell basically confirmed the less dovish outlook for interest rates that markets had already priced in with Powell indicating that inflation data has not provided the Fed with the greater confidence it wants and so it’s appropriate to leave rates high for longer. Interestingly, there was nothing from Powell suggesting higher rates - he doesn’t see the economy overheating but still sees the labour market moving into better balance and wages moderating helped by a boost in supply from immigration and rising workforce participation. Our base case remains for the first cut to come in September, although a July move is still possible.
- However, the news regarding other countries in relation to inflation and central banks has been more mixed, highlighting the potential for a divergence with the Fed. The UK, NZ, Japan and Canada all saw further falls in underlying inflation in March. In the UK and NZ there are still concerns about high services inflation so rate cuts there look unlikely until around August or October and Japan has barely started with rate hikes. But in Canada a rate cut is looking probable in June with BoC Governor Macklem commenting that “we don’t have to do what the Fed does…we do what Canada needs.”
- Similarly for the RBA – it doesn’t have to do what the Fed does! The combination of continuing economic growth, the still tight labour market and sticky services inflation mean that the RBA, like the Fed, is in no hurry to cut and that there is a very high risk that our expectation for rate cuts from around mid-year is too optimistic and that cuts won’t come till later this year. However, the RBA has not always just followed the Fed – after the GFC it started hiking in 2009 when the Fed was on hold near zero and the RBA was cutting and holding rates when the Fed was hiking over the 2015 to 2018 period. And right now, the Australian economy is far weaker than the US – with GDP growth less than half the US pace and consumer spending far weaker. As can be seen in the next chart the rise in interest rates over the last two years has had a far more negative impact on Australian than US households with debt servicing taking up nearly 20% of household income here compared to around 7.5% in the US. The reason is that household debt to income ratios are much higher here and average mortgage rates actually paid on outstanding housing debt have gone up by more than 3 percentage points in Australia compared to only about 0.5 percentage points in the US thanks to 95% of US mortgages being multi-decade fixed rates. So, the RBA starting to cut before the Fed may turn out to be justified, particularly if inflation data in the next week continues to show a further decline at a faster pace than the RBA is forecasting.
- Trump is near - US/China trade war ramping up again. After a few years of relative quiet but with President Biden largely maintaining the Trump era tariffs on China, he has now called for a tripling in tariffs on certain Chinese steel and aluminium imports to the US (from 7.5% to 25%). The direct impact on China and hence any flow on to Australia and more generally the US and global economies will be minimal as China only accounts for 1% of US steel supply and 3.6% of US aluminium imports. However, the populist protectionist move is clearly aimed at shoring up Biden’s support in key industrial states like Pennsylvania that he needs to win in the coming election. Further tariff hikes are likely in the run up to the election, eg on Chinese EVs and the US moves runs the risk that other countries will follow with tariffs on Chinese products. This is nothing compared to Trump’s talk of a 60% tariff on Chinese imports. But its yet again more evidence that globalisation is in retreat with protectionism on the rise (evident in Australia too with “Further Made in Australia”) which will result in a slightly more inflation prone world, higher than otherwise interest rates and lower than otherwise price to earnings ratio on shares over time.
Curated by James Gruber and Leisa Bell
Latest updates
PDF version of Firstlinks Newsletter
ASX Listed Bond and Hybrid rate sheet from NAB/nabtrade
Listed Investment Company (LIC) Indicative NTA Report from Bell Potter
Plus updates and announcements on the Sponsor Noticeboard on our website