The Weekend Edition includes a market update plus Morningstar adds links to two additional articles.
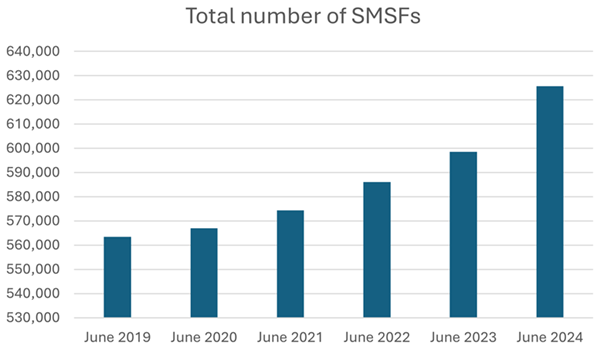
ATO data on SMSFs shows that 8,613 new funds were set up during the June quarter of this year, the highest quarterly growth since 2018. There were also 2,954 closures during the quarter, resulting in 5,659 net new SMSFs being created.
For the 2024 financial year, there were 32,747 new funds established. 5,702 SMSFs were wound up, meaning there were 27,045 net new funds created during the year. That net figure was more than double that of the prior year.
All up, there are now 625,609 SMSFs, with 1.15 million members, a 4.5% rise in both in the year to June.

Source: ATO
The young seem to be driving recent growth in SMSFs. In the June quarter, 36% of new members were aged between 35 and 44 – below the average SMSF member age at establishment of 45. Still, 64% of SMSF members remain 55 years and over.
All up, SMSFs now control $990 billion in assets ($957 billion net of liabilities). That figure represents about 26% of the total amount in superannuation in Australia.
The average assets per SMSF is $1.55 million, while the median assets per fund is $877,498.

About 24% of SMSFs have assets between $100,000 and $500,000, and almost two-thirds have assets between $500,000 and $5 million. Just 5% are above the $5 million mark.

Source: ATO
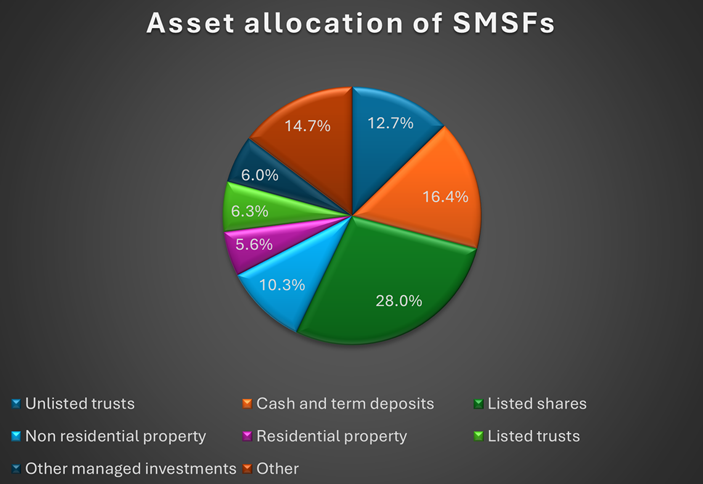
As to how SMSFs are allocating their assets, about 28% is in listed shares, 16% in cash and deposits, 13% in unlisted trusts, 10% in non-residential property, and 6% in residential real estate.

Source: ATO
In the 12 months to June, the biggest increases in value were seen in listed and unlisted trusts, as well as listed shares.
Generally, SMSFs with $5 million or more held more in unlisted trusts, listed shares, and less in cash and term deposits, than those with fewer assets.
****
Another quarter in markets has ended, and here are the results.

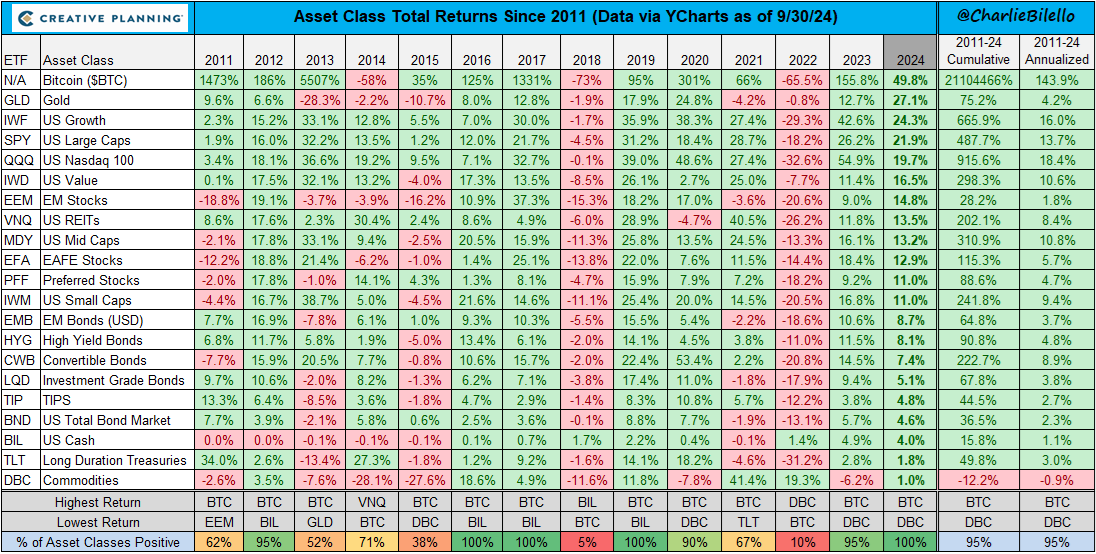
You haven’t had to be a genius to make money this year or last, thanks to the ‘everything’ bull market. Every asset class is up in 2024, and that follows a year when every asset class bar one was ahead too.
It’s amusing that many of the world’s central bankers and politicians think interest rates are too high and financial conditions too restrictive when most assets are flying.
The S&P 500 is up 22% year-to-date, the best start to a year since 1997 and the best start to a presidential election year in history. Growth stocks have outperformed while mid and small caps have lagged.
Meanwhile, the Nasdaq has risen 20% this year following a barnstorming 2023. Note though that the Nasdaq has lagged the S&P 500 over the past quarter and this year, which suggests that the bull market has broadened out beyond tech stocks.
Emerging markets are playing catchup and have rocketed over the past quarter. That’s in no small part due to China recent economic stimulus. The Shanghai Index was up a record 25% in the five days to October 1.
Meanwhile, bonds and cash have been serviceable this year also. Those declaring last year that the 60/40 portfolio was dead have been proven wrong again.
Bitcoin has been 2024’s best performing asset. If that trend continues in the final quarter, it will make 11 of the past 14 years that Bitcoin has been the top performing asset. Staggeringly, it’s returned 144% per annum (p.a.) since 2011.
Gold has shined this year too, up 27% in US dollar terms, and 40% of the past 12 months. A declining US dollar has helped, as has geopolitical tensions in the Middle East.
If this year holds, it will be the fourth year of the past 14 where 100% of asset classes achieve positive returns.
A big driver has been the 15-year bull market in stocks. The S&P 500 has returned 14% p.a. and the Nasdaq 18% p.a. since 2011. The S&P’s return is well above the 10% per annum average returns through history.
With many other assets now joining in the party, could this signal the maturation or near-end to this bull market? Time will tell.
****
The Aussie market is also reaching new highs. It was 2% in September and is up 9% in 2024. Though the ASX 200 has performed well, it’s badly lagged some other markets such as the US.
A big rotation out of ASX banks into miners seems to be gaining steam, as traders pounce on the potential positives for commodities from China’s stimulus package.
The major banks were either flat or down for the month. Though keep in mind that their 2024 performance remains well in the green. Westpac is up 38%, NAB 22%, CBA 21%, and ANZ 18% year-to-date. That performance been a headscratcher given earnings for all the banks have been going backwards.
Though it can be partly explained by depressed commodities for much of the past year and investors have had few other options in Australia but to invest in the banks. Now that’s changing, and a big rotation from banks to miners is starting.
The question is whether Chinese stimulus will boost its economy along with inputs such as commodities. Zooming out, it’s clear that China had an enormous credit and property bubble which has burst. That cycle will eventually bottom out. However, the boom brought forward the country’s consumption of commodities, and it’s hard to see how that over-consumption doesn’t mean revert going forward.
There’s also the larger issue of a government that’s proven incompetent in running the economy and has little interest in its entrepreneurs and investors making money.
Stimulus is unlikely to fix these larger issues in China.
****
Recently, a friend asked me for advice on where to find writers and websites that could educate him about investing. In my article this week, I seek to answer that question by taking a step back and looking at the qualities of those who provide the best education and guidance on investing, with examples such as Warren Buffett, Charlie Munger and Peter Thornhill. I suggest that if you find these qualities in writers and practitioners, then you'll likely find investment wisdom.
James Gruber
Also in this week's edition...
Are demographics destiny for the stock market? Nick Maggiulli looks at fascinating recent research on the topic, and suggests that while demographics influence economies and stock markets, other factors like technology and policy can have a significant impact too. He believes that diversifying across income-producing assets can help mitigate demographic-driven challenges.
Toll road operator, Transurban, has been in the headlines of late as politicians eye re-writing contracts to prevent annual price rises in line with inflation. Has the company's gravy train come to an end? Ashley Owen gives his views.
As this bull market matures, it's giving rise to so-called wicked asset classes. According to Niels Jensen, these are the untraditional assets like collectables that often rally late in cycles. He says they can be great fun, though people should follow some simple rules to avoid some of the errors he's made in the past.
Capitalisation rates or 'cap rates' are a widely used valuation metric in property. However, they have shortcomings which are becoming more evident as real estate moves beyond the big three subsectors of office, retail, and industrial. Phoenix Portfolios' Stuart Cartledge outlines the pros and cons of cap rates.
Research from The Conexus Institute reveals that 50,000 Australians who are retiring over the next year may not be able to access an account-based pension because they don't meet minimum application requirements of their super fund. David Bell and Geoff Warren believe that needs to change.
Do trade sanctions work? It's a timely issue as the US soon goes to the polls to potentially elect a second-term Donald Trump, who has flagged further sanctions against the likes of China. Michael McAlary goes through recent examples of countries which have managed to adapt and thrive despite sanctions. Because of this, Michael thinks sanctions don't have the same impact they used to.
Two extra articles from Morningstar for the long weekend. Simonelle Mody weighs up a surging ASX healthcare name and Joseph Taylor asks how much growth runway WiseTech has left.
Lastly, in this week's whitepaper, Charter Hall provides its outlook for Australian industrial and logistics property.
****
Weekend market update
On Friday in the US, a hotter-than expected September jobs report did nothing to derail the potent bull market in stocks, with the S&P 500 climbing nearly 1% to mark its seventh weekly increase in its last eight tries, though Treasurys came under marked pressure as the long bond rose eight basis points to 4.26% while the two-year note vaulted to 3.93% from 3.7% Thursday. WTI crude remained on the front foot by advancing towards US$75 a barrel, gold finished little changed at US$2,651 per ounce, bitcoin rallied to US$62,300 and the VIX settled just below 19.
From AAP Netdesk:
The Australian share market fell on Friday, shaken by an offhand comment by US President Joe Biden on oil. The benchmark S&P/ASX200 index on Friday finished 55.2 points lower at 8,150.0, a fall of 0.67%, while the broader All Ordinaries dropped 57.7 points, or 0.68%, to 8,416.6. The ASX200 dropped 0.76% for the week, snapping its three-week winning streak.
On Friday, nine of the ASX's 11 sectors finished lower and two closed higher.
Health care rose 0.1% and energy rose 1.8% on the back of the spike in oil prices.
Woodside gained 2.2%, Santos added 2.1% and Ampol rose 2.9%.
On the flip side, the mining sector was the biggest loser, dropping 1.2%. BHP dropped 1.7% to $44.58, Rio Tinto retreated 1.9% to $123.68 and Fortescue fell 1.1% to $19.76.
All of the big four banks finished lower as well. Westpac fell 1.9% to $30.14, CBA subtracted 1.4% to $132.74 and ANZ and NAB both lost 1.5%, to $29.64 and $36.43 respectively.
Insurance companies gained ground amid the possibility that interest rate cuts might be delayed. Speaking broadly, lower rates hurt insurance companies' bottom lines as they must keep policyholders' premiums in short-term investments in anticipation of claims. IAG gained 1.8%, Suncorp rose 1.3% and health insurer Medibank Private advanced 1.1%.
Looking forward, minutes from the Reserve Bank's last meeting will be released on Tuesday, and Federal Reserve minutes on Wednesday.
From Shane Oliver, AMP:
- Global share markets were mixed over the last week as the war in the Middle East escalated further with Iran’s retaliatory missile strike on Israel and investors nervously waiting to see whether Israel’s response will threaten global oil supplies but solid US jobs data signalling that the US economy remains resilient providing support on Friday. For the week US shares gained 0.2% as the resilient jobs data pushed it back into positive territory, but Eurozone shares fell 2.2% and Japanese shares fell 3%. Chinese shares rose on 8.5% on Monday on the back of policy stimulus but have been closed since for a holiday. Reflecting the Middle East worries Australian shares also fell by 0.8% with falls led by consumer, mining and financial stocks, despite a surge in energy shares. Oil prices rose on the back of supply disruption fears by 9%. But despite the uncertainty there wasn’t a generalised trend to safe havens with the $US up and the $A down but bond yields up on resilient US jobs data and the gold price little changed. Iron ore prices surged on the back of Chinese stimulus, but metal prices fell. So, all up a pretty messy week.
- US payrolls were strong but other data was mixed. Payrolls rose a far stronger than expected 254,000 in September with prior months revised up, unemployment falling to 4.1% (from 4.2%) and average hourly wages growth perking up to 4%yoy (from 3.9%). This is consistent with jobless claims remaining low. Against this though, other US economic data was mixed. The ISM manufacturing index remained weak at 47.2 with a fall in the prices component. But the services ISM rose to a solid 54.9 with a rise in prices. However, forward looking jobs indicators continue to point to labour market softness ahead. The employment components in both of the ISM surveys saw further weakness in September, job openings rose in August, but the trend remains down and the proportion of workers quitting for new jobs continues to plunge (suggesting less job opportunities). And temporary employment and hours worked fell which can be a sign of softness. For the Fed the strong September payrolls report will provide it with confidence that the US economy remains resilient and it’s not “behind the curve” in cutting rates, but given the weakness in leading indicators and slowing inflation its likely to continue cutting – but at the pace of 0.25%, not 0.5%. Of course, there is more jobs and inflation data to come ahead of its next meeting in November.
- Australian economic data releases over the last week were a mixed bag suggesting the economy is continuing to muddle along with weak growth. Retail sales rose a stronger than expected 0.7% in August. This may reflect the tax cuts but the combination of hotter than normal weather (pulling forward spring purchases) and Fathers’ Day falling on the first day of September (bringing more related spending into August) are likely to have been the main drivers with bank card data suggesting that spending eased in September. In the meantime, real retail sales per person remain depressed.
- Despite the rise in retail sales, the ABS’s Monthly Household Spending Indicator was flat in August with annual growth slowing to 1.7%yoy, pointing to ongoing weakness in real consumer spending. Combined with a surge in household deposits in August it suggests that most of the tax cuts have been saved so far. Maybe we will need it to pay for higher petrol prices!
Curated by James Gruber and Leisa Bell
Latest updates
PDF version of Firstlinks Newsletter
ASX Listed Bond and Hybrid rate sheet from NAB/nabtrade
Listed Investment Company (LIC) Indicative NTA Report from Bell Potter
Plus updates and announcements on the Sponsor Noticeboard on our website