Melbourne and Sydney have placed first and third as the most popular destinations to invest in commercial property in the Asia-Pacific region in 2019.
Australia’s strong underlying economic growth combined with high yields relative to other Asia-Pacific markets, good prospects for rental growth and market transparency are driving continued domestic and global investor interest in the Melbourne and Sydney commercial property markets according to the latest results from the ULI/PwC 2019 industry survey[1].
Relative yields are important
Although yields in Australia are close to record lows (circa 4.75% - 5.0% for high quality office and retail, and 5.5% for high quality industrial), they remain higher than those in other Asia-Pacific gateways. Hong Kong and Tokyo yields are now below 3.0% while Shanghai yields hover just above 3.0% and Singapore yields are circa 3.5%.
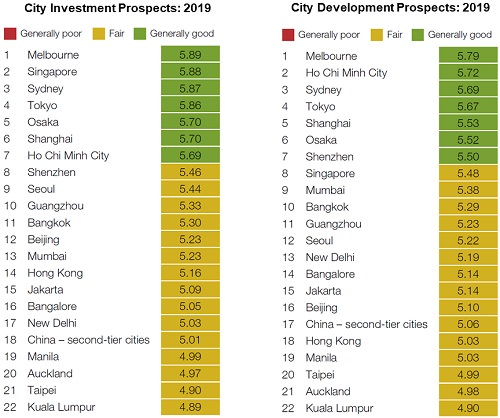
Melbourne has overtaken Sydney as the best prospect in the Asia-Pacific region for both investment and development (see Figure 1), with Sydney slipping from No. 1 to No. 3 this year. The top four markets for investment in 2019 are:
- Melbourne (first in investment, first in development) – Melbourne offers a constrained office supply pipeline, a good yield spread over the cost of debt and sovereign bonds, a deep, liquid, core market and good prospects for rental growth
- Singapore (second in investment, eighth in development) – an improvement in Singapore’s office market has caused the city to take second spot as it rebounds from cyclical lows
- Sydney (third in investment, third in development) – Sydney offers the same reasons as Melbourne, and is a favourite of global investors due to relatively high returns and as a safe-haven play. Competition for assets has helped sustain pricing, while low vacancies and growing demand for space suggest rents will continue to rise.
- Tokyo (fourth in investment, fourth in development) – Tokyo’s move to fourth is somewhat surprising after last year’s drop. This reflects cheap finance, attractive leverage, a good spread over other interest rates and a large stock of investment-grade assets.
Figure 1: City investment and development prospects: 2019

Source: ULI/PwC
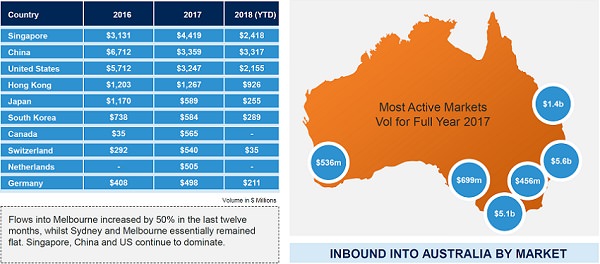
With abundant capital seeking a home in the Asia-Pacific region, it’s not surprising that Australia continues to be a beneficiary of cross-border money flows. Most of the capital being deployed into Australia is coming from both high net worth families and Asian-based funds domiciled in Singapore and Hong Kong, US real estate equity funds and insurance companies, and the Chinese (see Figure 2).
Despite restrictions on Chinese capital flows, more than $3 billion of Australian assets have been acquired in the first nine months of 2018. This is well down on the $6.7 billion invested in 2016 but is set to pass the $3.4 billion invested in 2017. Recent Chinese investing has largely been driven by corporates and high net worth private investors who have capital reserves outside of China.
Figure 2: Capital flows into Australia: 2016 - 2018

2018 YTD – as at 30 September 2018. Source: Perpetual/Real Capital Analytics
Logistics tops shopping list of sectors
Logistics topped the list in the ULI/PwC survey as the most preferred property sector to invest across the Asia-Pacific region in 2019. For most institutional investors, industrial remains a small component of their investment portfolios, well behind office and retail. This is changing as investors re-rate industrial and some are now seeing it as the retail of the future in their portfolios.
Demand for industrial space is being driven by businesses looking for greater efficiency through the optimisation of their supply chains and warehouse footprints. There is a rise of e-commerce logistic players wanting large, state of the art distribution centres located at major transport hubs. More recently, demand has also spread to last-mile delivery hubs, which provide smaller fulfillment facilities strategically located nearer to, or in, city centres allowing retailers and third-party logistics providers (3PLs) to offer next day, or even inter-day (two hour) delivery.
Investors have responded by driving down industrial yields to enter the sector. The yield spread between industrial and both office and retail property has compressed more over recent years than in previous cycles. According to JLL, prime Sydney industrial yields currently average 5.38%, just 0.63% higher than prime Sydney CBD office yields at 4.75% and 0.56% higher than prime retail yields at 4.82%.
Focus on income in future
2019 is set to be a pivotal year for Australian commercial property. If the ULI/PwC survey is any guide, Australia will remain an attractive destination for foreign capital. Competition for assets will remain high, with the office and industrial sectors being particularly attractive. Yet at this point in the cycle, after eight plus years of yield compression and strong capital growth, income is set to become the main driver of investment returns. Investors will be well served seeking quality assets with long-term leases underpinned by strong tenant covenants. It is these assets that will provide the best protection against any turbulence stemming from disruptions in the broader capital markets.
Adrian Harrington is Head of Capital & Product Development at Charter Hall, a sponsor of Cuffelinks. This article is general information and does not consider the circumstances of any investor.
For more articles and papers from Charter Hall (and previously, Folkestone), please click here.
[1] The ULI/PwC 2019 Emerging Trends in Real Estate Asia Pacific Report is based on the opinions of 350 real estate professionals, including investors, developers, and lenders who were surveyed on the prospects for both property investment and development markets and property finance and capital markets in the Asia-Pacific region.