"Extraordinary claims require extraordinary evidence," according to the Sagan Standard, the observation made popular by astronomer Carl Sagan. Any large superannuation fund claiming it outperforms the market should provide the proof, but for Australian equities, the public evidence does not support the assertion.
Diving into the data
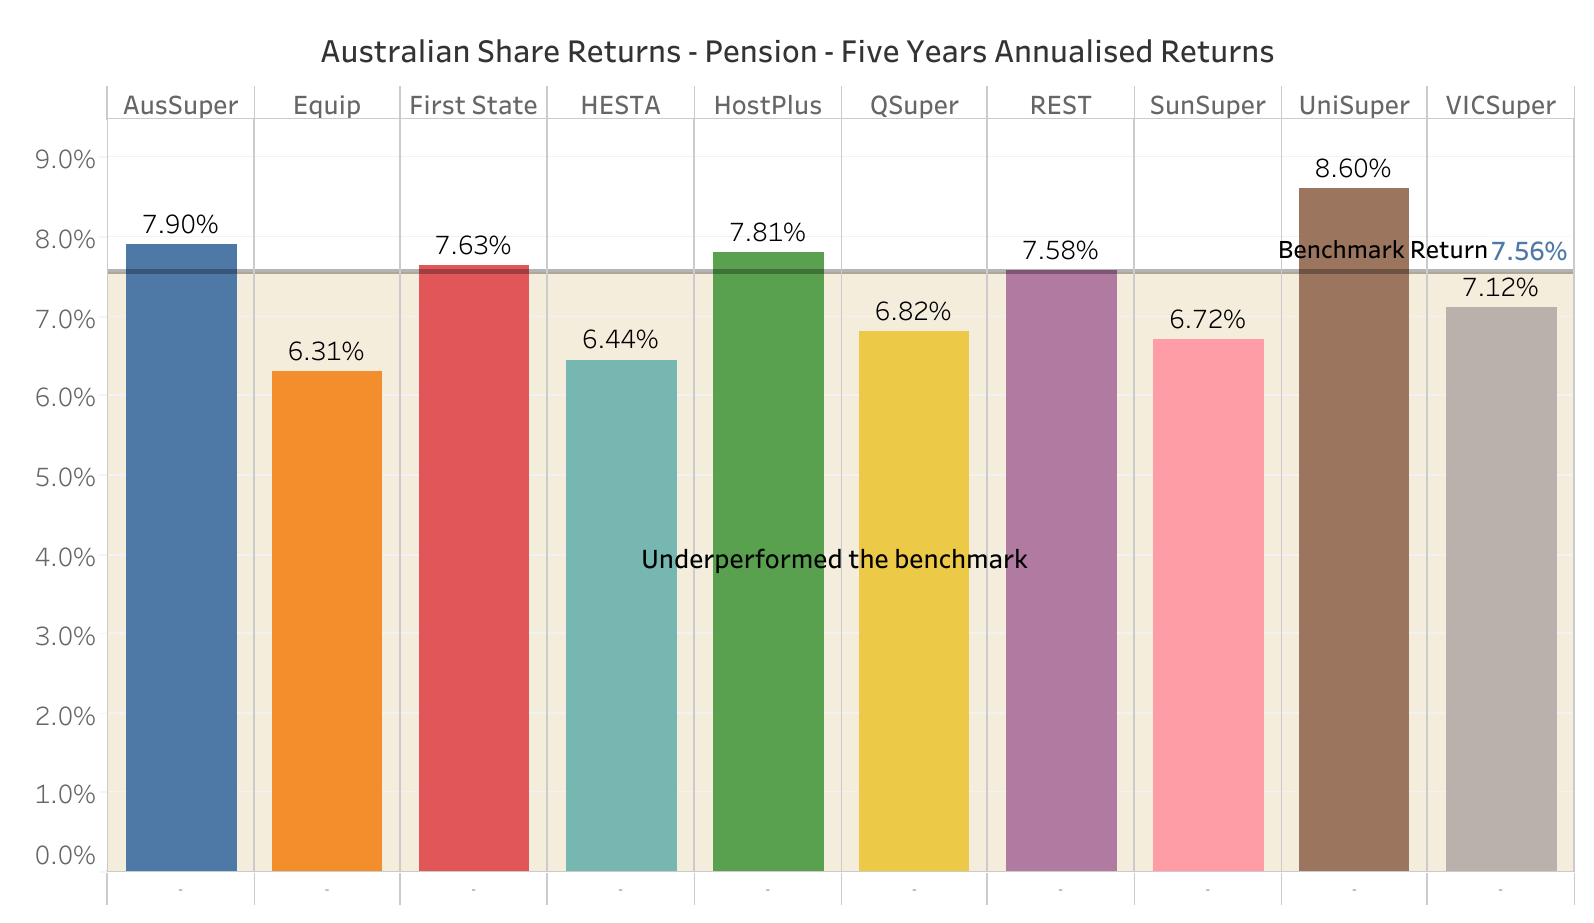
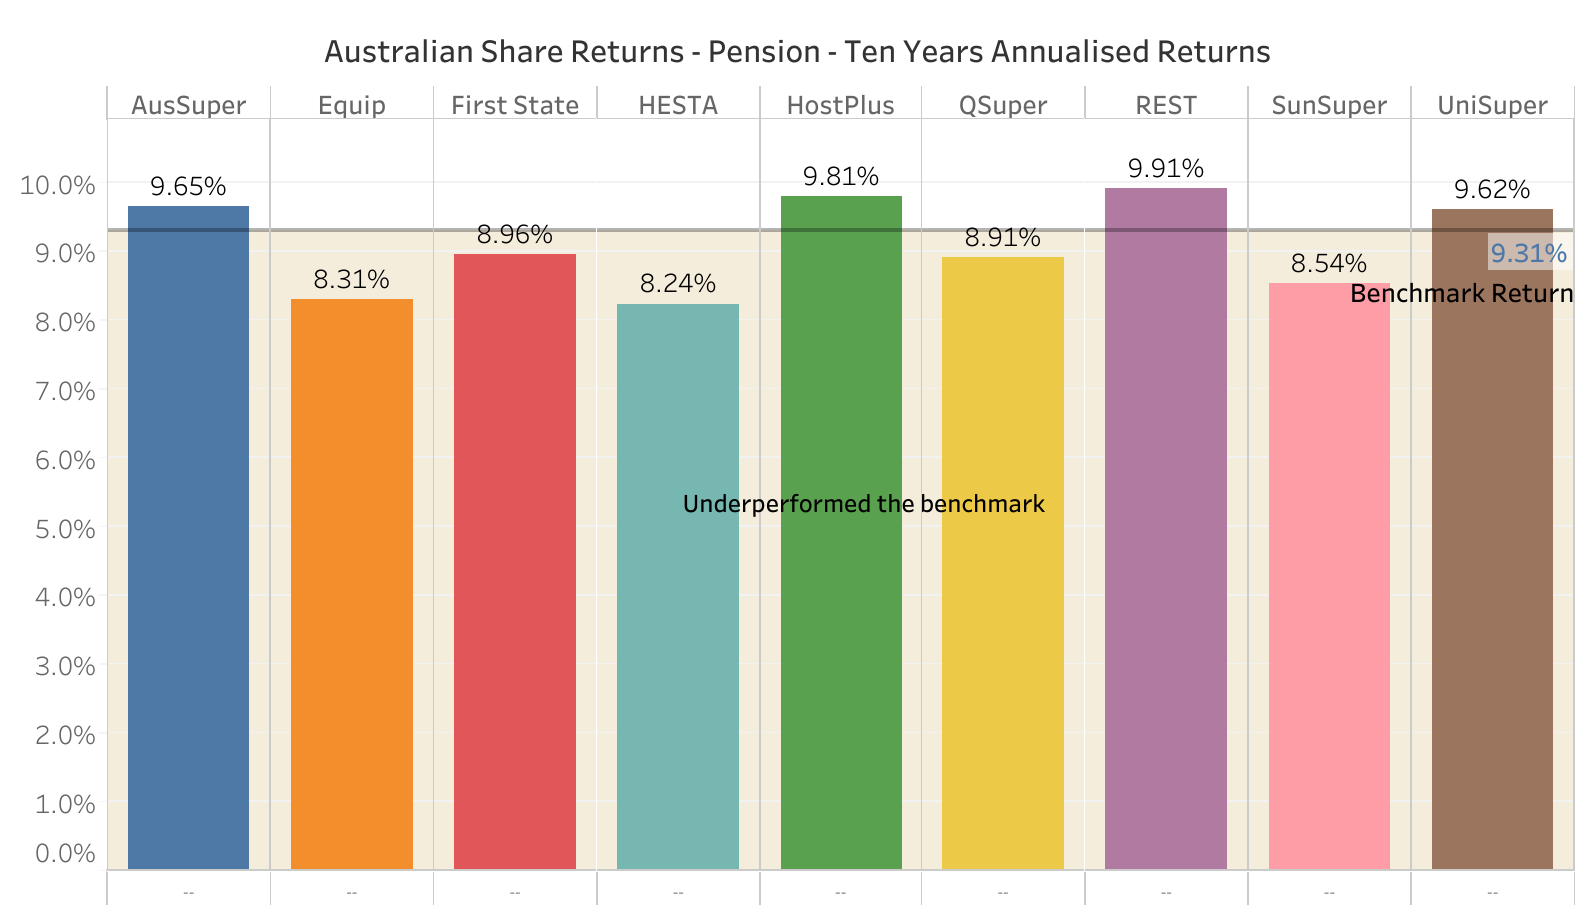
A sample of Australia’s largest superannuation funds shows the average performance for Australian equities over five years after fees for a pension account was 7.29% versus a benchmark return of 7.56%. For 10 years, the average return was 9.11% compared to a benchmark of 9.31%. At best, this result suggests that superannuation funds with their large investment teams performed no better or worse than an individual investing in a passive equity fund.
APRA was not short of critics when it introduced its Heat Map to judge fund performance. Superannuation funds, asset consultants and rating agencies all joined in. Assessing fund performance is indeed tricky, but the mediocre performance by superannuation funds for Australian equities supports APRA taking an analytical view.
We, at BigFuture, took a straightforward and conventional approach to compare superannuation funds’ performance for Australian equities. First, we took the returns of a superannuation fund’s pension tax-exempt fund. This avoids the debate about a fund’s after-tax returns with the split between current versus capital gains. Second, we compared these returns to the S&P/ASX300 Total Return Index Adjusted for Franking Credits (SPAX3F0). Some superannuation funds prefer to have the S&P/ASX300 Accumulative Index, but there is a free kick here as those franking credits have value.
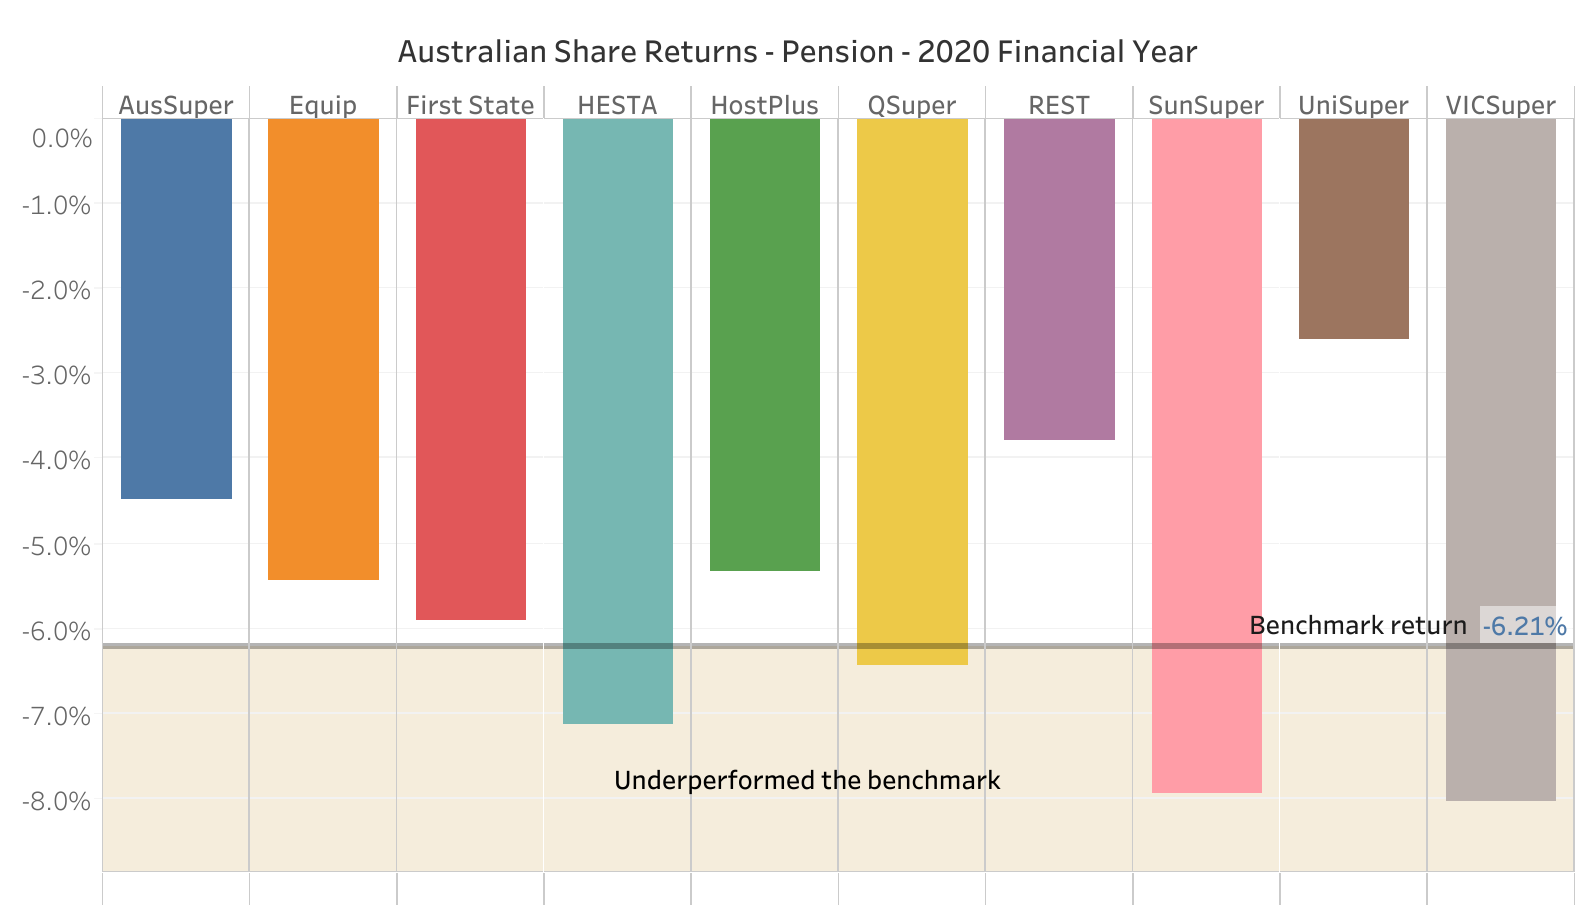
First, the good news. Superannuation funds did beat our benchmark for the last financial year to 30 June 2020. The benchmark return was -6.21% compared with the average superannuation return of -5.71%. 50 basis points (bps) or 0.5% outperformance is very useful in a down year.

Note: CBUS and CSS do not have Australian Shares investment options.
However, when we look over the longer-term, the picture is less rosy. The returns for five years show an average return of 7.29% against a benchmark return of 7.56%. HostPlus, who The Australian Financial Review seems to take pleasure tormenting due to its investments in unlisted assets, performed well beating the benchmark by 25 bps (0.25%). The standout was UniSuper, beating the benchmark by 104 bps or 1.04%. The average return declines from 7.29% to 7.10% if we exclude UniSuper.

Critics of APRA’s Heat Map say five years is too short a period to compare funds. Some suggest 30 years but let’s get serious. No superannuation fund would keep an Australian equity manager who underperformed for 30 years. Members should not do the same.
Over 10 years, these large superannuation funds are struggling. The average return for superannuation funds is 9.11% after fees compared to our benchmark return of 9.31%.

Is close to the benchmark reasonable?
To be fair, these returns look like noise around the benchmark, but expert investment teams are expensive and their processes are complicated. It would be interesting to know how many superannuation trustees are challenging the assumption of deploying these resources for no additional return. Trustees may be impressed by the economic and political savvy of active managers but where is the extra return beyond good marketing? QSuper Australian equities fund wins our gold star for going passive.
An article like this wins no friends. You don’t get employed or become rich by criticising superannuation funds. Investment teams, asset consultants, active managers and even rating agencies all earn good incomes. No doubt, there will be critics who say the logic of this analysis is flawed. But if this is wrong and we tried our best to analyse the data in detail, and if no one else can provide reliable numbers to the contrary, then we will leave it to APRA to sort it out. Members should have easy-to-access, comparable data.
One way to look at it is that superannuation funds perform no better or no worse than the index. Perhaps one reason is superannuation funds now own so much of the Australian share market. It’s hard for one professional team to beat another professional team. In 2019, Rainmaker estimated that superannuation funds owned 40% of the total share market and this was expected to grow to over 50% by 2030, a trend supported by Deloitte.
A second reason for seeing an outperformance only last year could have been that institutional investors were favoured over retail investors with new equity raisings during COVID. This is speculative but worth analysis.
Member difficulty understanding the benchmark
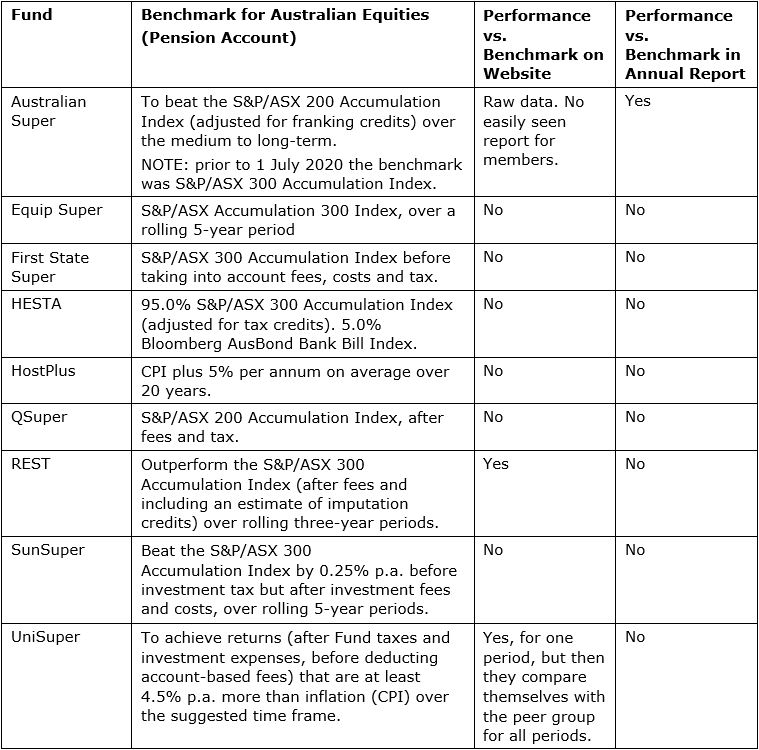
Consider the table below to see the challenges for a member to work out if their superannuation fund is competitive and performing well for the most straightforward asset class with the simplest of benchmarks.

Amid criticism, APRA is pushing ahead with its Heat Map, and it will be notable whether the soon-to-be-released Retirement Income Review 'fact base' reaches a firm conclusion on large fund performance.
Donald Hellyer is CEO of BigFuture. BigFuture is a technology consulting and development company specialising in building applications for fund managers, superannuation funds, brokers and banks. This article is general information based on public data and does not consider the circumstances of any investor.