Register For Our Mailing List

Register to receive our free weekly newsletter including editorials.

Home / 446

SMSF returns competitive with big funds at $200,000

Introduction: In this report commissioned by the SMSF Association, researchers at the University of Adelaide used data provided by BGL Corporate Solutions and Class Limited from over 318,000 SMSFs between 1 July 2016 and 30 June 2019, to identify the minimum amount of capital required for an SMSF to achieve comparable investment returns with much larger funds.

When coupled with research by the actuarial firm Rice Warner in late 2020, which found SMSFs with balances of $200,000 or more were cost effective compared with industry and retail superannuation funds, it supports the competitiveness of SMSFs with balances of $200,000 or more compared with larger funds.

The research also found SMSFs generate greater variation in fund-level performance relative to APRA-regulated superannuation funds. SMSFs with more diversified asset allocations achieve higher returns.

***

Investment performance comparisons between SMSFs and APRA funds have historically been difficult to make. APRA relies on information from financial statements to generate a Rate of Return (ROR) for APRA regulated funds, whereas SMSFs are regulated by the Australian Taxation Office (ATO), which produces a Return on Assets (ROA) measure for SMSFs based on data collated from SMSF annual returns.

The research took anonymised financial statement data and calculated an annual ROR for each fund in the data sample. A median ROR for the SMSF sector was then derived from the individual fund RORs. To compare against SMSF median ROR, a similar approach was used for the APRA fund sector with a median APRA fund ROR derived from APRA’s annual fund-level superannuation statistics back series.

Key findings

1. SMSF ROA consistently underestimates actual SMSF performance, with evidence suggesting this gap is widening over time.

The table below compares the differences between the ATO’s published ROA returns for the SMSF sector and the ROR calculated for each individual SMSF in the data sample for the period 2017 to 2019.


2017

2018

2019

Median ROR (via this research)

6.9%

6.0%

6.2%

Median SMSF ROA (via ATO)

5.0%

4.0%

4.3%

Source: Understanding SMSF performance, table 3.

The research found the ATO’s median ROA calculation underestimates the SMSF median ROR on average by more than 1.9% over the 3-year period from 2017 to 2019. This is over 50% larger than what was presented to the Productivity Commission for the period 2006 to 2016.

There are fundamental and irreconcilable differences between SMSF annual return data and SMSF financial statement data. While in recent times the ATO has made adjustments to align their ROA calculation measure more closely with ROR, ultimately it is not possible for the ATO to fully replicate APRA’s ROR calculation.

While it may be appropriate to use the ATO’s SMSF median ROA and average investment return figures to compare the performance of the SMSF sector with other years, these figures should not be used to compare the performance of the SMSF sector with other sectors

2. SMSFs with net assets of more than $200,000, that are not concentrated in cash and term deposits, outperformed APRA regulated funds in two out of three years between 2017 and 2019.

When comparing the headline performance of APRA funds with SMSFs, at the median APRA funds outperformed SMSFs in two out of three years between 2017 and 2019.

However, when small cash-heavy SMSFs are excluded, the opposite result is observed – SMSFs outperformed APRA funds in two out of three years between 2017 and 2019.


2017

2018

2019

All SMSFs

6.9%

6.0%

6.2%

APRA funds

7.8%

7.6%

6.2%

SMSFs with more than $200,000 and with less than 80% cash or term deposits

8.0%

6.6%

6.5%

Note: All returns in the above table are median RORs. Source: Understanding SMSF performance, table 6.

Of particular interest in this research study is the investment performance of SMSFs which actively invest. Excluding SMSFs which, either by default or choice, abstain from making investment decisions, provides a more useful indicator of performance.

Similarly, SMSFs with balances below $200,000 are more likely to lack the critical mass required to keep pace with larger funds (see research result 5).

Excluding SMSFs which meet either of these conditions (i.e. SMSFs with balances below $200,000 or with more than 80% of the fund balance invested in cash and term deposits) provides a more meaningful comparison of performance relative to APRA funds.

The research found SMSFs with significant cash holdings were associated with significant performance impairment for the three years between 2017 and 2019. The research also found a strong positive relationship between fund size and fund performance for balances up to $200,000. These results indicate the overall performance of the SMSF sector could be improved by identifying and assisting investors with small, cash heavy SMSFs.

3. SMSFs generate greater variation in fund-level performance relative to APRA funds

SMSFs have a higher propensity to outperform and a higher propensity to underperform relative to APRA funds.

While this is a feature of the broader range of investment options available to SMSF investors, it is also a feature of the significant difference in population sizes between the two cohorts.

The greater variation in fund-level performance, and a higher propensity to outperform relative to APRA funds, presents opportunities for advisers to add value, and deliver higher rates of return for suitable superannuation investors.

It also presents opportunities for advisers to assist SMSF investors who have a higher propensity to underperform.

4. In aggregate, SMSFs with more diversified asset allocations achieve higher returns

The performance benefits of adding a second, third or fourth asset class are strong and consistent across the 2017–19 period. Each incremental increase in asset classes (up to 4) is associated with an improvement in median ROR of between 1% to 3%. Diversification beyond 4 asset classes (up to 7) also improves aggregate SMSF performance, but at reduced marginal rates.

The results are consistent with standard finance theory. Higher levels of diversification are correlated with improved  levels of investment performance.

The research results provide tangible evidence of the benefits of diversification. The research results underline the benefits of a properly formulated investment strategy and supports the regulatory focus on SMSFs with inadequate levels of investment diversification.

5. SMSFs achieve critical mass at balances of $200,000 or more

The performance of a typical SMSF improves as the balance of the fund approaches $200,000. Once this threshold is reached, the performance of the fund is comparable with SMSFs with much larger balances as illustrated by the flat line in the shaded zone in the figure below.

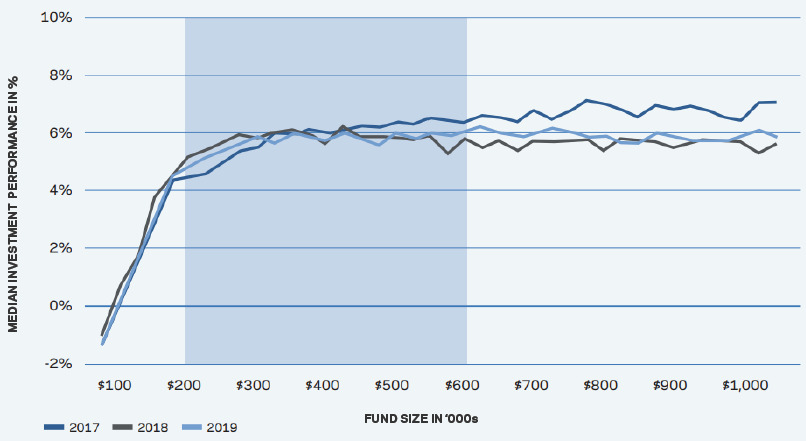
Source: Understanding SMSF performance, figure D2.

The research supports the regulatory focus on fund size, but it also suggests that current guidelines around minimum SMSF balances are poorly calibrated. The research data revealed no material differences in performance patterns for SMSFs between $200,000 and $500,000, so the notion that smaller SMSFs in this range deliver materially lower returns, on average, than larger SMSFs in this range, is not supported by the research results.

Fund size is important, but mainly for explaining the performance of SMSFs with balances up to $200,000. Beyond this threshold, fund size does little to explain fund performance, at least for the period 2017-2019.

This result complements research released by Rice Warner in 2020 on the cost of operating an SMSF which found SMSFs with balances of $200,000 or more, are cost competitive with both Industry and Retail funds.

In relation to fund size, prospective and existing SMSF investors (and their advisers), should have confidence in the performance prospects if they have $200,000 or more in net assets.


Peter Burgess is Deputy CEO and Director of Policy & Education at The SMSF Association. George Mihaylov is a Lecturer at The University of Adelaide’s International Centre for Financial Services. The full research paper can be downloaded here. This article is general information only.


5 Comments
Jerome Lander
February 19, 2022

Very interesting and clearly a SMSF that invests well can perform relatively well. Also note that none of the performances in absolute terms are particularly high, even in what was a bull market. Diversification is now more important than ever given the outlook for the new few years. Good alternative managers provide this diversification whereas bonds, equities and property are potentially all correlated in the bear market.

Irene
February 21, 2022

I have SYD and SKI in my SMSF, and it represented total 7% of my portfolio. My portfolio is diversified in different sectors but now besides TCL, APA and AIA (NZ), what more for us to buy to diversify for infrastructure?

Geoff
March 04, 2022

suggest you investigate an ETF such as VBLD which will increase your exposure with far greater diversification

Bobthebuilder
February 17, 2022

I am sitting with a large industry fund. Invested through their members option (pick your ETFs / shares etc). The fund reports my unrealised CG, which is now around 3-4% of the fund value. Trying to work out, I have 10yrs to retirement.. Weirdly if the market crashed I would be happier to set up the SMSF as I wouldn't be setting it up with 97c in the dollar (but perhaps 90c buying cheaper assets...)
Is there any clarity / analysis as to working this out

Rob
February 16, 2022

None of this is rocket science and the "noise" that the size of a SMSF needs to be $200,000 to be competitive is a nonsense. Simple reality, every Retail and Industry Fund bases at least a portion of their fees on Fund Size - it is the cup that keeps on giving! Markets rise, revenue rises, costs stay more or less flat... A fund of $1m will pay significantly more in fees in a retail or industry fund environment than a fund of $50,000 whereas in reality, it COSTS not a cent more, for an Administrator to run a $1m account vs a $50,000 account or indeed a $10,000 account. There is and always has been, a massive disconnect in the way fees are charged and that then feeds straight through to performance. Plenty of SMSF's out there with tax and admin costs less than 5bp, dramatically less than retail or industry funds. Unit costs clearly diminish as the size of the fund grows but the admin/tax costs stay fixed - that is the SMSF "model". Anyone starting a SMSF gets this and whether they start with $100k or $200k, is pretty much irrelevant - what is important is where they see the fund growing to in 5/10 or 20 years time. As to Asset Allocation which is "primary" and stock selection which is "secondary" it is now so easy for a SMSF to replicate or go very close, to any industry fund or even the Future Fund - it is now all published data, just copy it! Lastly, especially in retirement, a SMSF gets 100% of any franking credit, whereas in an Industry or Retail Fund there is "leakage" as the credit cannot be specifically allocated to an individual account and the ATO approves an averaging methodology. Bottom line, for any large super fund or one that expects to rapidly grow, a SMSF is a no brainer on costs and franking credit and, with a little effort, it can easily replicate or beat underlying performance numbers. 


Leave a Comment:

RELATED ARTICLES

Why I’m not ready for an SMSF

The death of the single-industry superannuation fund

The 'Contrast Principle' used by super fund test failures

banner

Most viewed in recent weeks

How much do you need to retire comfortably?

Two commonly asked questions are: 'How much do I need to retire' and 'How much can I afford to spend in retirement'? This is a guide to help you come up with your own numbers to suit your goals and needs.

Meg on SMSFs: Clearing up confusion on the $3 million super tax

There seems to be more confusion than clarity about the mechanics of how the new $3 million super tax is supposed to work. Here is an attempt to answer some of the questions from my previous work on the issue. 

The secrets of Australia’s Berkshire Hathaway

Washington H. Soul Pattinson is an ASX top 50 stock with one of the best investment track records this country has seen. Yet, most Australians haven’t heard of it, and the company seems to prefer it that way.

How long will you live?

We are often quoted life expectancy at birth but what matters most is how long we should live as we grow older. It is surprising how short this can be for people born last century, so make the most of it.

Australian housing is twice as expensive as the US

A new report suggests Australian housing is twice as expensive as that of the US and UK on a price-to-income basis. It also reveals that it’s cheaper to live in New York than most of our capital cities.

Welcome to Firstlinks Edition 566 with weekend update

Here are 10 rules for staying happy and sharp as we age, including socialise a lot, never retire, learn a demanding skill, practice gratitude, play video games (specific ones), and be sure to reminisce.

  • 27 June 2024

Latest Updates

Investment strategies

The iron law of building wealth

The best way to lose money in markets is to chase the latest stock fad. Conversely, the best way to build wealth is by pursuing a timeless investment strategy that won’t be swayed by short-term market gyrations.

Economy

A pullback in Australian consumer spending could last years

Australian consumers have held up remarkably well amid rising interest rates and inflation. Yet, there are increasing signs that this is turning, and the weakness in consumer spending may last years, not months.

Investment strategies

The 9 most important things I've learned about investing over 40 years

The nine lessons include there is always a cycle, the crowd gets it wrong at extremes, what you pay for an investment matters a lot, markets don’t learn, and you need to know yourself to be a good investor.

Shares

Tax-loss selling creates opportunities in these 3 ASX stocks

It's that time of year when investors sell underperforming stocks at a loss to offset capital gains from profitable investments. This tax-loss selling is creating opportunities in three quality ASX stocks.

Economy

The global baby bust

Across the globe, leaders are concerned about the fallout from declining birth rates and shrinking populations. Australia, though attractive to migrants, mirrors global birth rate declines, and faces its own challenges.

Economy

Hidden card fees and why cash should make a comeback

Australians are paying almost two billion dollars in credit and debit card fees each year and the RBA wil now probe the whole payment system. What changes are needed to ensure the system is fair and transparent?

Investment strategies

Investment bonds should be considered for retirement planning

Many Australians neglect key retirement planning tools. Investment bonds are increasingly valuable as they facilitate intergenerational wealth transfer and offer strategic tax advantages, thereby enhancing financial security.

Sponsors

Alliances

© 2024 Morningstar, Inc. All rights reserved.

Disclaimer
The data, research and opinions provided here are for information purposes; are not an offer to buy or sell a security; and are not warranted to be correct, complete or accurate. Morningstar, its affiliates, and third-party content providers are not responsible for any investment decisions, damages or losses resulting from, or related to, the data and analyses or their use. To the extent any content is general advice, it has been prepared for clients of Morningstar Australasia Pty Ltd (ABN: 95 090 665 544, AFSL: 240892), without reference to your financial objectives, situation or needs. For more information refer to our Financial Services Guide. You should consider the advice in light of these matters and if applicable, the relevant Product Disclosure Statement before making any decision to invest. Past performance does not necessarily indicate a financial product’s future performance. To obtain advice tailored to your situation, contact a professional financial adviser. Articles are current as at date of publication.
This website contains information and opinions provided by third parties. Inclusion of this information does not necessarily represent Morningstar’s positions, strategies or opinions and should not be considered an endorsement by Morningstar.