The 60/40 portfolio (i.e., 60% growth / 40% defensive assets) has become emblematic of an industry-wide challenge; how to build diversified portfolios in an environment of anchored cash rates and negative real bond yields. With the likelihood of more subdued returns from defensive asset classes over the medium term, the ability of managers to implement active management strategies that achieve the dual purpose of enhancing returns and controlling volatility has been a key focus across this year’s review cycle.
The following is an exploration of the effectiveness of the 60/40 portfolio to deliver CPI plus objectives under a scenario where asset class valuations are expensive and defensive asset classes are offering less in terms of income and portfolio diversification.
The 60/40 portfolio – a historical perspective
Investors have been treated to a period of strong returns, largely by virtue of a massive structural decline in inflation and interest rates, set against the backdrop of reasonable economic growth, a global savings glut and supportive policy settings. There have been setbacks along the way, including the sharp downturns in the early 2000s, 2008-09 and 2020, but each was met with increasingly aggressive monetary policy easing.
The traditional 60/40 portfolio (represented by the Median Manager in the Zenith Multi-Asset – Balanced Universe) has performed strongly amidst this market backdrop, generating returns of 6.5% p.a. and 5.3%, over the past 10 and 20 years respectively. With inflation averaging just 2% over the past 10 years and 2.4% over the 20 years, the traditional 60/40 portfolio has easily achieved its return objective with relatively low volatility. The following table summarises the performance of the Median Manager for the 10-year period ending 31 August 2021.
Table 1 Zenith Multi-Asset Universe – Balanced – Median Manager Performance as at 31 August 2021
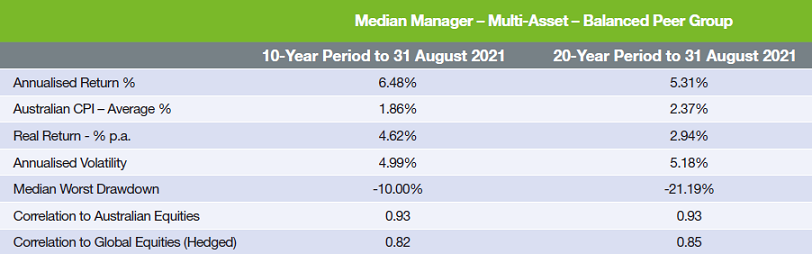
Source: Fund Managers
Within the 60/40 construct, when equity market drawdowns have occurred, bonds have generally provided the diversification expected offsetting equity market declines through a combination of yield and capital growth associated with declining yields on long duration securities. Even in the COVID equity market downturn, bonds provided some gains to help cover initial equity losses.
The following chart depicts that an allocation to bonds has generally worked, certainly in the last 20 years, although that was not the case in the 20 preceding years, particularly in real terms.
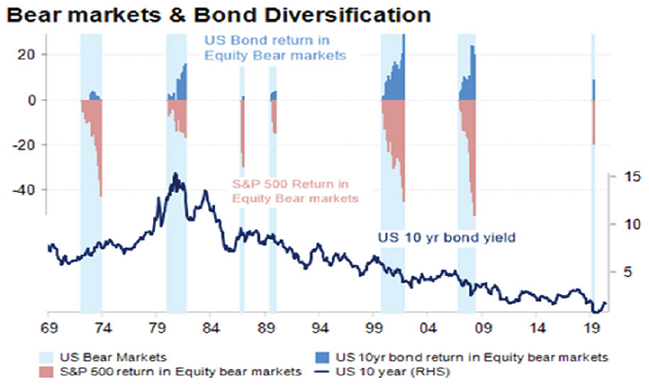
Source: St Louis Fed, IRESS, Heuristics
The 60/40 portfolio in a low yield environment
The ability of the 60/40 portfolio to deliver CPI plus 3% p.a. (representing the most common return objective in Zenith’s Diversified – Balanced sub-category), under a scenario where asset class valuations are stretched and the ‘40’ component (or defensive sleeve) is offering less in terms of real returns and portfolio diversification, was a key theme across this year’s review cycle.
The role of the ‘40’ component is to produce consistent income (or carry), exhibit low volatility and diversify equity risk, with the income or carry component closely linked to the level of cash rates and bond yields. Based on our research, the yield-to-maturity (YTM) of the major domestic and global bond benchmarks provides a reasonable proxy for future return expectations over the medium-term.
To illustrate this, the following chart compares the YTM of the Bloomberg Barclays Global Aggregate Index with the return realised over the following five years.
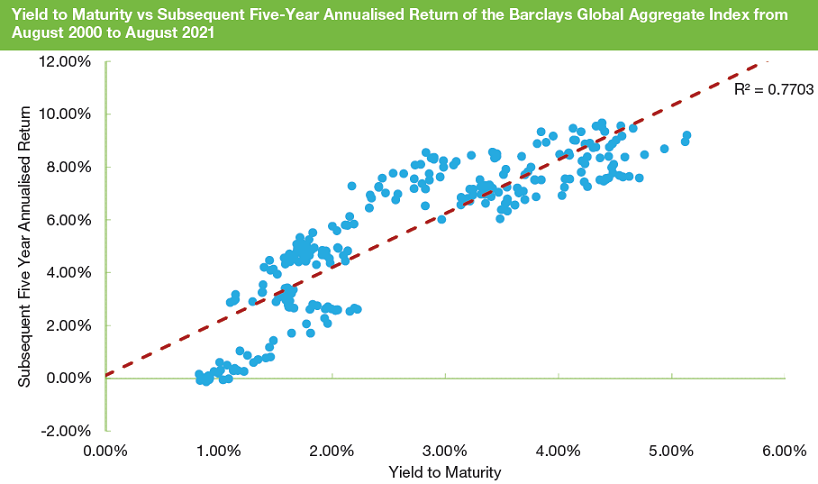
Source: Zenith Investment Partners
Based on the chart above, the Coefficient of Determination (R2) over the analysis period is 0.77, representing high explanatory power. With the YTM of the Bloomberg Global Aggregate Index (Hedged) and Bloomberg AusBond Composite Index (0+ maturities) being 0.95% p.a. and 0.85% p.a. (as at 31 August 2021), the ability of fixed income to generate meaningful real returns is questionable and such returns are likely to be well below the CPI objectives of a typical Balanced fund.
With the ‘40’ component likely to undershoot most CPI-linked objectives, the growth allocation is expected to become more important with respect to meeting real return objectives. Across the peer group, the view on equities was broadly constructive as corporate profits continued to rebound, supported by accommodative fiscal and monetary policy settings.
From a valuation perspective, equities are supported by their relative attractiveness to fixed income, most notably, higher yields and tax efficient income streams. However, the relative relationship is highly sensitive to inflation and government bond yields remaining at their current levels. At an absolute level, the following chart plots US and Australian Shiller P/E’s which is a ratio measuring the current index level divided by trailing 10-year earnings adjusted for inflation.
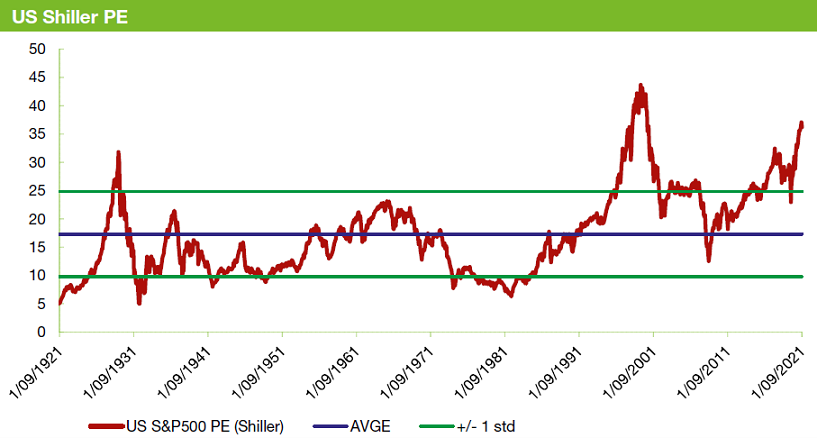
Source: Heuristics
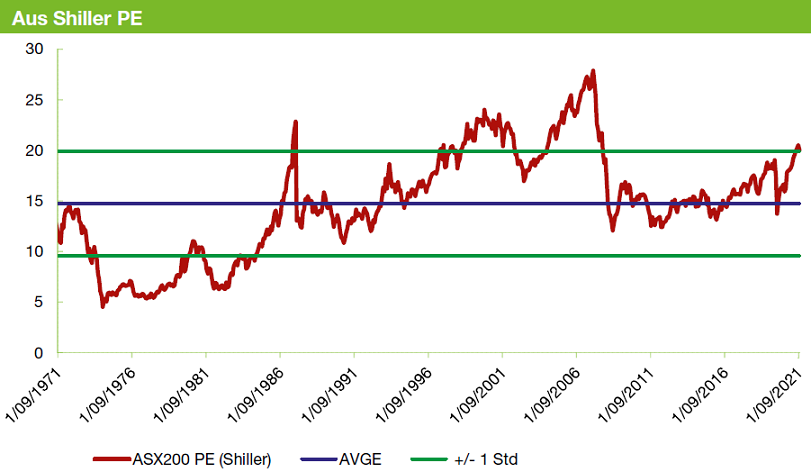
Source: Heuristics
The US and Australian Shiller PEs are trading at approximately 36 and 21 respectively, representing a significant premium to the historical averages (purple and green line). If these valuations were to revert to long-term averages over the next decade, this would have significant implications for the ability of the 60/40 portfolio to meet objectives.
The outlook for the 60/40 portfolio
Using the Zenith Heuristics asset allocation framework, we have modelled the potential impact of bond yields remaining at current levels and equity market Shiller P/E’s mean reverting to longer term averages over a 10-year horizon. The Heuristics model assumes earnings per share (EPS) growth of 6% p.a. and a dividend yield of 4% p.a. and the portfolio is rebalanced on a monthly basis.
The following chart plots the hypothetical performance of the portfolio over the next 10 years.
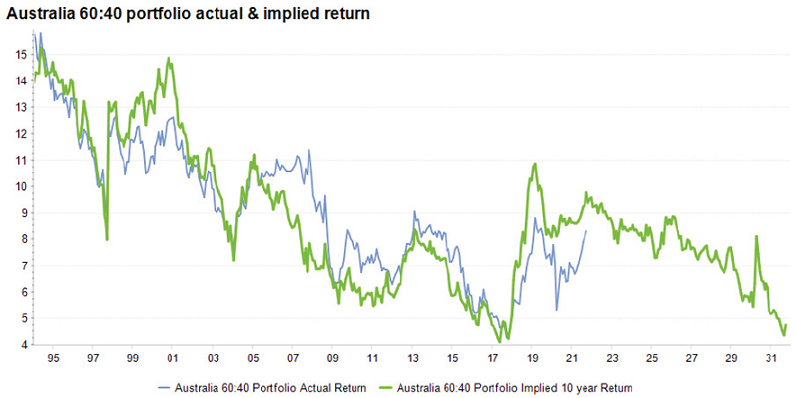
Source: ABS, RBA, Refinitiv, IRESS, using proxy updates
Under the mean-reversion scenario, the forecast return for the 60/40 portfolio is approximately 4.4% p.a., well below the prior returns experience. Further, Heuristics long-term projection for domestic CPI is 2.25% p.a., meaning Balanced investors are facing a potential return shortfall over the next decade. While the forecast is subject to input sensitivity, it highlights that a 60/40 portfolio can no longer rely on structural tailwinds from declining bond yields and rising equity market valuations to meet return objectives.
Conclusion
The 60/40 portfolio has become a metaphor of the challenges associated with constructing diversified strategies in an environment where bonds offer unattractive real yields and the ‘40’ component is offering less in terms of diversifying equity risk and controlling drawdowns.
While the typical Balanced Fund can no longer rely on structural tailwinds from declining bond yields and rising equity market valuations to meet return objectives, Zenith remains highly supportive of the level of process innovation across the Multi-Asset – Diversified peer group.
Andrew Yap is Head of Multi-Asset and Australian Fixed Income at Zenith Investment Partners. This article provides general information only and does not take into account the objectives, financial situation or needs of any specific person who may read it.