Register For Our Mailing List

Register to receive our free weekly newsletter including editorials.

Home / 579

Which asset classes are a bargain now?

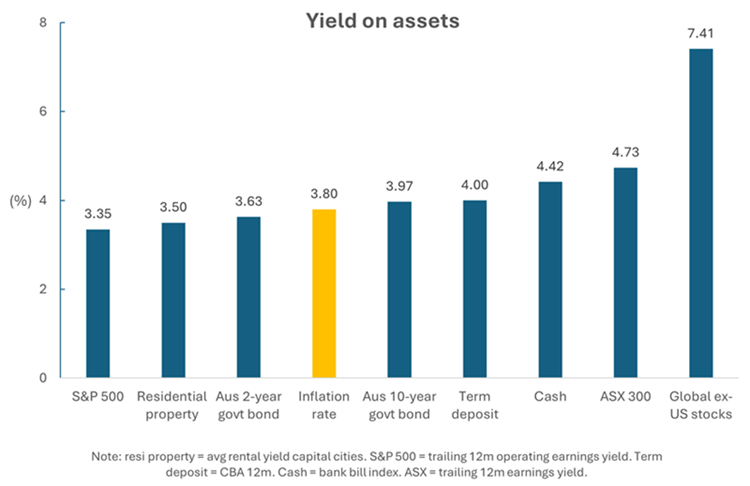
Periodically, I give an update on the valuations of key asset classes and how they compare. Here’s the latest chart on yields for the four major asset classes: cash, bonds, property, and stocks. I’ve included the inflation rate as a point of comparison.


Sources: Firstlinks, CoreLogic, Robert Shiller, CBA, ASX, Morningstar

What stands out is that the yields on many asset classes are quite condensed. When I’d compiled this chart 10 months ago, inflation was much higher and there was a greater dispersion in yields. Most assets have performed well of late and that’s lowered the yields for them.

It seems to me that most of the assets are pricing in inflation coming down further. The reason is that when you buy an asset, you’re hoping to earn a yield above the inflation rate ie. a positive real return. Yet some asset classes are currently yielding below the inflation rate, and others are only marginally above. Note that in the above chart, I've used the quarterly inflation figure, which is widely considered more reliable than the monthly number. 

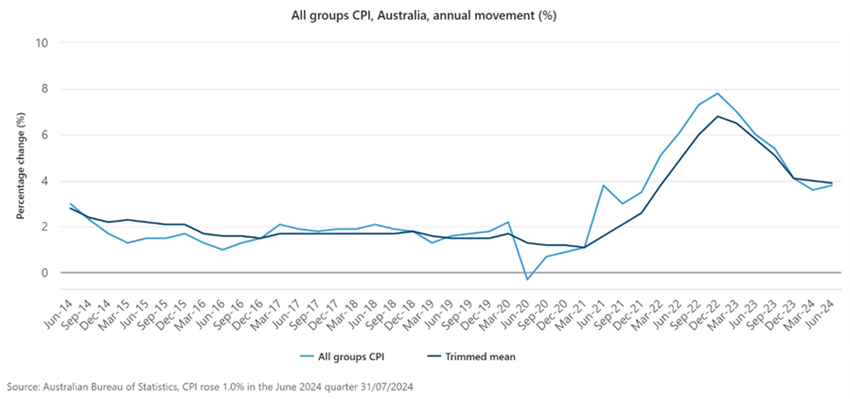
The odds favour inflation declining further, though whether it goes lower and stays lower is the question. Australia has stickier inflation than many other developed countries after not raising rates as aggressively.

The overvalued: US stocks

Let’s first run through what I consider the overvalued asset classes. The S&P 500 looks expensive, and parts of it appear very expensive. On most valuation metrics, it’s 1-2 standard deviations overvalued compared to history.

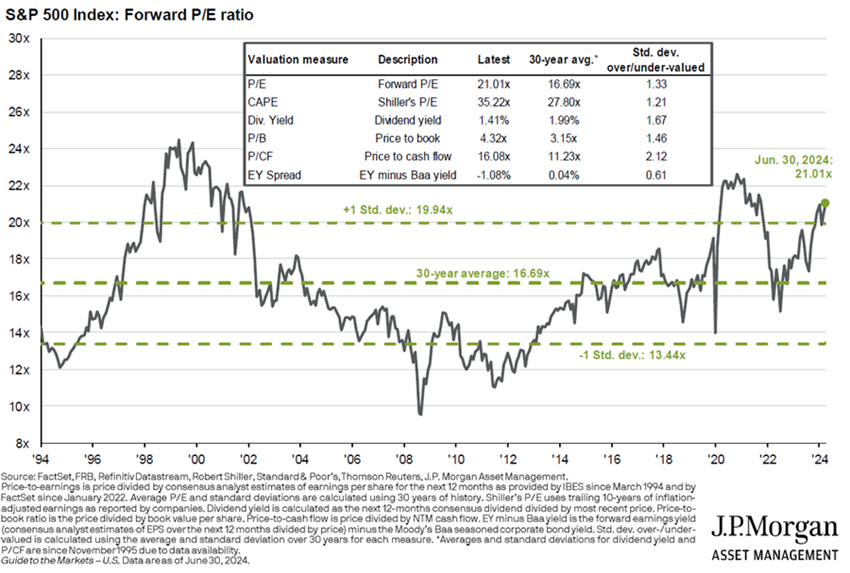
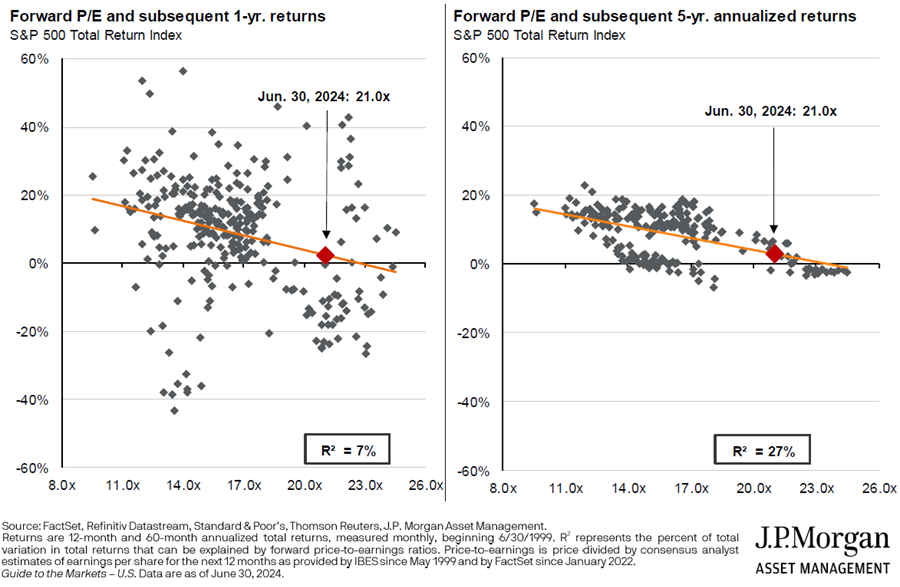
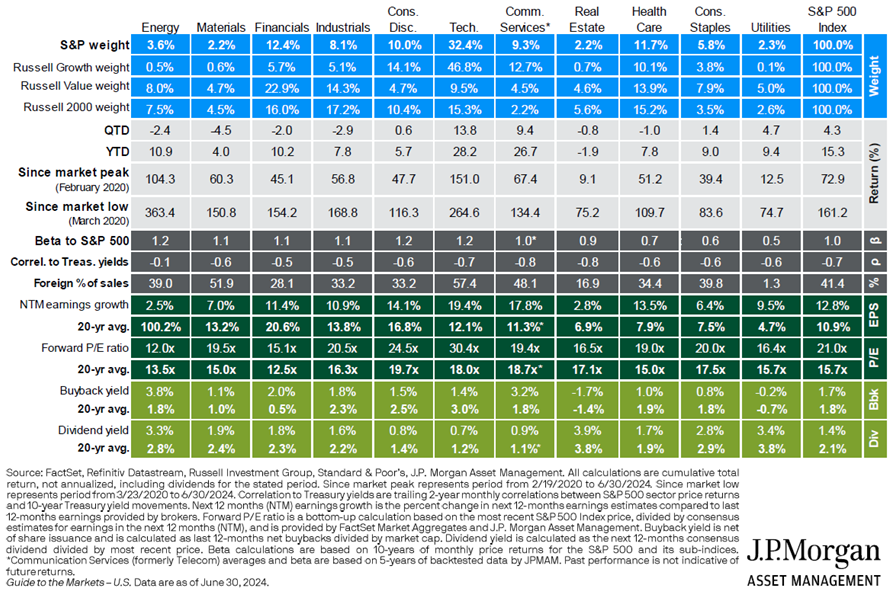
At a 21x forward price-to-earnings ratio (PER), the S&P 500 is well above its average PER of 16.7x. Through history, the higher the PER, the lower future returns have been.

The technology, consumer discretionary, and healthcare sectors in the US look most overvalued. For instance, US tech is trading at 30x forward P/E versus its 18x average of the past 20 years.

Much of the overvaluation resides among the largest companies in the US. Many are pricing in gains from AI and the consensus outlook for an economic soft landing in America. If either of these falters, earnings may disappoint, and valuations will come under pressure.

The overvalued: Australian housing

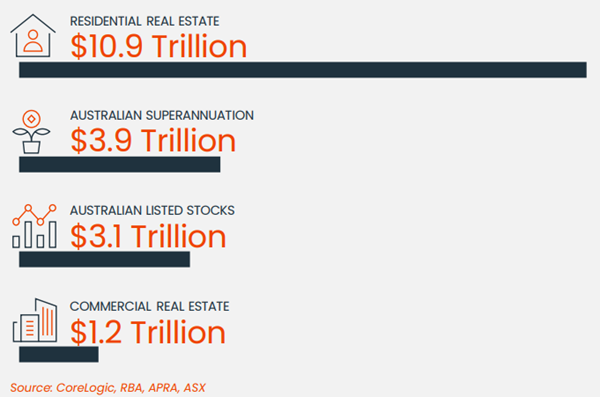
Residential real estate dwarfs every other asset in size in Australia. At almost $11 trillion dollars, it’s 3.5x larger than the market for publicly listed stocks, 2.8x bigger than the superannuation sector, and 2.5x total GDP.

I’ve stated previously that residential property in Australia is possibly the most expensive asset anywhere in the world. And that it’s at least 40% overvalued, in my view. I stand by that view, and here’s why.

The gross rental yield on property is 3.5% in capital cities. That gross yield is essentially revenue for a landlord. Therefore, the yield essentially equates to a price to sales (P/S) ratio of 29x (ie. 100 divided by the gross yield).
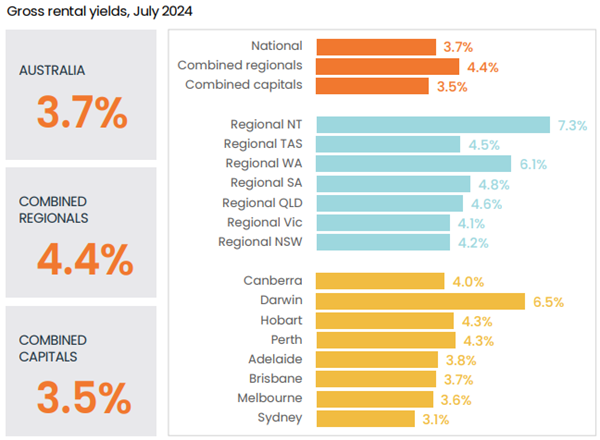

Source: CoreLogic

That P/S ratio is extraordinarily expensive. For instance, Nvidia – the world’s third largest company by market capitalization and regarded by most observers as expensive if not bubble-like – currently trades at a P/S ratio of 28x.

That’s not the fully story though. The gross yield on property comes before costs, including maintenance, interest, and taxes. Property experts I speak to suggest maintenance and other operating expenses would reduce that yield by at least 1%. In other words, the yield would be sub-2.5%, and that’s before taxes.

Let’s be generous and call it a 2.5% net yield for residential property. That equates to a price-to-earnings ratio of 40x. Again, compared to the pricey US tech sector, that P/E ratio also looks high. And remember, US tech company earnings are growing exponentially, while those of property aren’t.


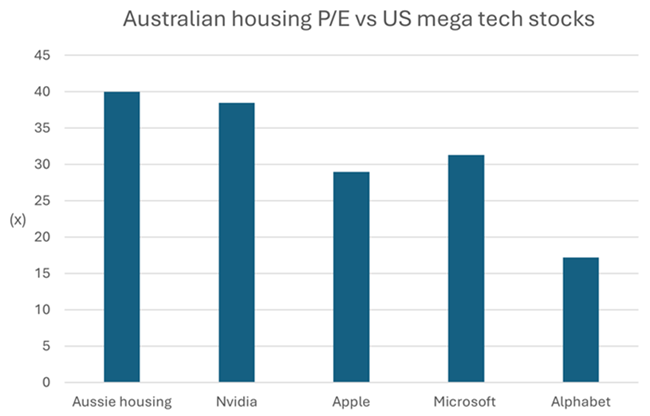
Note: tech stocks = forward P/E. Source: CoreLogic, Morningstar

Compared to other housing markets around the world, Australia also stands out. The price to income ratio is 9.7x, about double that of the US. The ratio has more than trebled over the past 40 years.

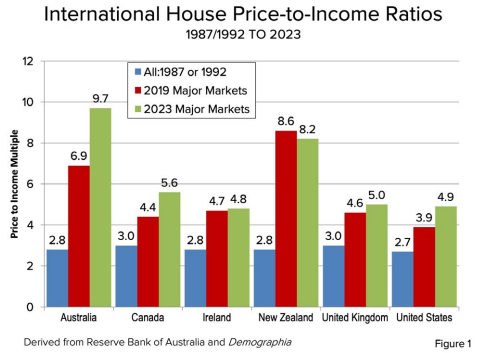
Australia has three cities in the top 10 least affordable metropolitan markets in the world, according to consultants, Demographia. Incredibly, the likes of Adelaide rank as less affordable than global destinations such as New York.

For price to income ratios to decline, either prices must drop or incomes need to rise. The outlook for incomes looks relatively muted. Meanwhile, supply constraints mean prices are unlikely to come down in the near term, though growth from here may prove more challenging.

In other words, Australian residential real estate may be one of the globe’s most expensive assets, but it’s likely to remain that way, at least in the short term.

The undervalued: international stocks

Outside of the US, stocks look reasonable value. International stocks have had mediocre returns over the past decade, badly lagging America’s.


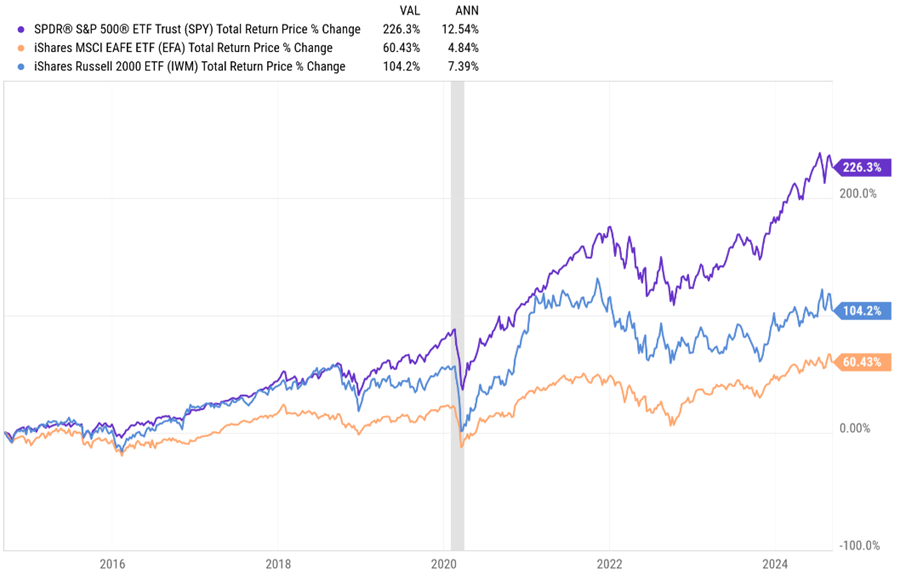
Source: A Wealth of Commonsense

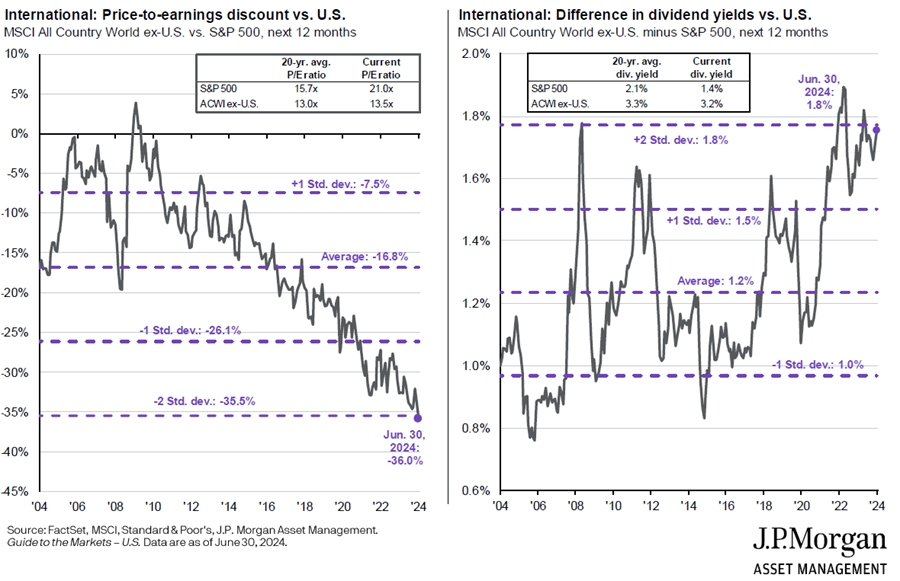
That’s led to favourable valuations for global stocks, especially compared to the US. The dividend yield on international shares of 3.2% is also much higher than the 1.4% of the US.

Of the different markets, Japan and Emerging Markets offer good value. China is cheap and due for a bounce back, though whether that proves sustainable will depend on fixing a broken political and economic model.
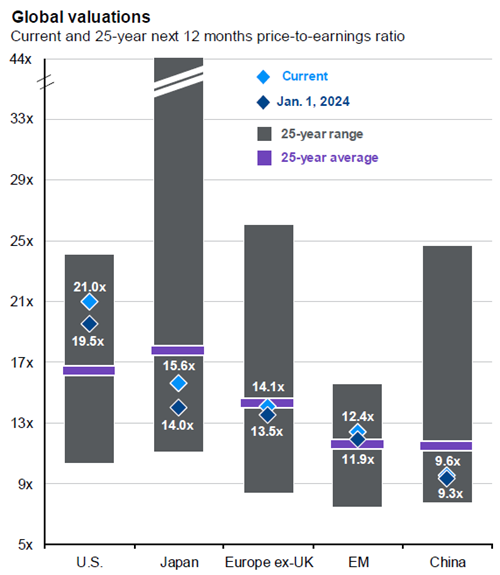

Source: JP Morgan

The undervalued: value stocks

Value stocks may also be an opportunity. Over the past 15 years, growth stocks have left value stocks for dead. Because of this, there are few true value-oriented fund managers left. It’s resulted in value being inexpensive.

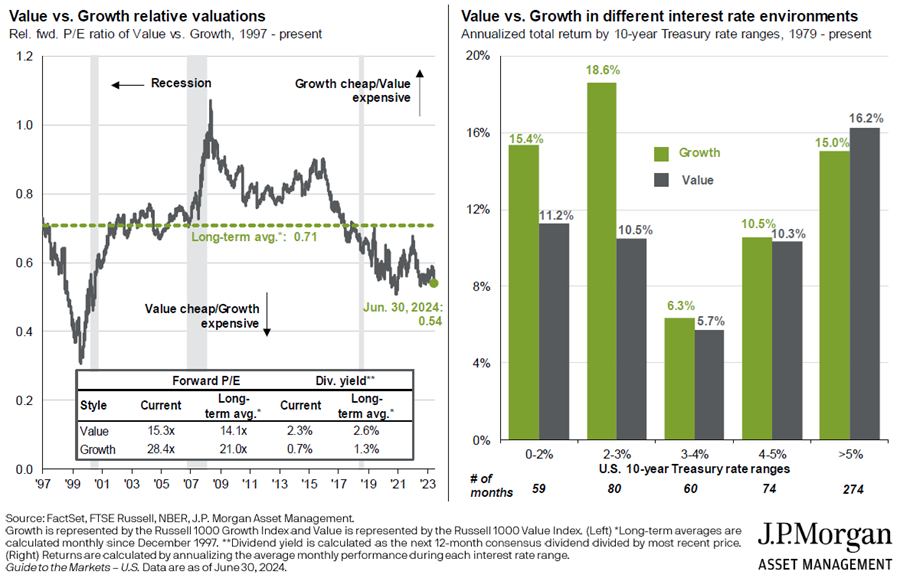
Interestingly, the chart on the right shows that value stocks perform especially well in higher interest rate environments. So, if you’re worried about high inflation and rates, owning value stocks makes sense.

The undervalued: small caps

Small caps may also be a contrarian play. They’ve significantly underperformed large caps in Australia and globally over the past decade, leaving them on undemanding valuations. Smaller companies are generally carrying larger debt loads, which means that they’re more sensitive to changes in interest rates. If rates are heading down, small caps may be a primary beneficiary.

The undervalued: cash

It seems odd to say that cash is undervalued, though I’d suggest it might be.

Investors poured money into term deposits last year, after stocks and bonds endured a poor 2022. That defensive stance has slowly switched. This year, the cash in term deposits has eked out into risk assets as investors get more comfortable with the outlook for the likes of equities.

The question is whether term deposits are still attractive in the current environment. With 12 month term deposits of up to 4.9% available at reputable banks, there still appears to be value here, especially with inflation at 3.8% and many risk assets offering inferior yields.

The fairly valued: Australian bonds

Bonds have performed reasonably well over the past 12 months, though most retail investors still seem to be gun shy given the poor performance of this asset class over the prior three years.


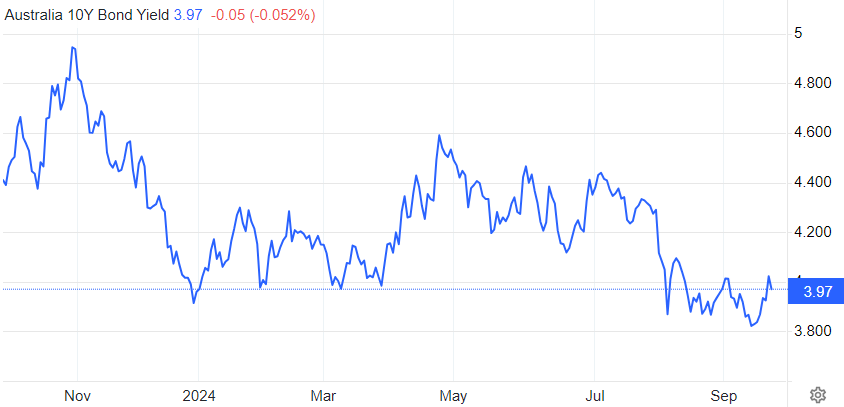
Source: Trading Economics

At this time last year, many investors were declaring that the 60/40 portfolio (60% equities, 40% bonds) was dead. That’s proven overblown.

However, given the recent pickup in bond prices, the yields on bonds are less attractive now. With 2-year Australian bond yields at 3.63% and 10-year yields at 3.97%, they don’t offer the same value as they did 12-18 months ago. And the key risk for bonds is that inflation stays sticky in Australia.

How do bonds compare to cash? The two assets serve different purposes in a portfolio. Cash is more of a placeholder, until there’s a better place to allocate money. Bonds serve as a ballast in a portfolio, buffering it against the potential for sharp drawdowns in riskier assets. Bonds also gives investors protection against economic downturns, which is something that cash doesn’t do.

The fair valued: Australian stocks

The other asset that seems fair valued is Australian stocks. It’s deceptive, however, as the market is split between the haves and have nots. On the one hand, the prices for tech companies are extraordinary.

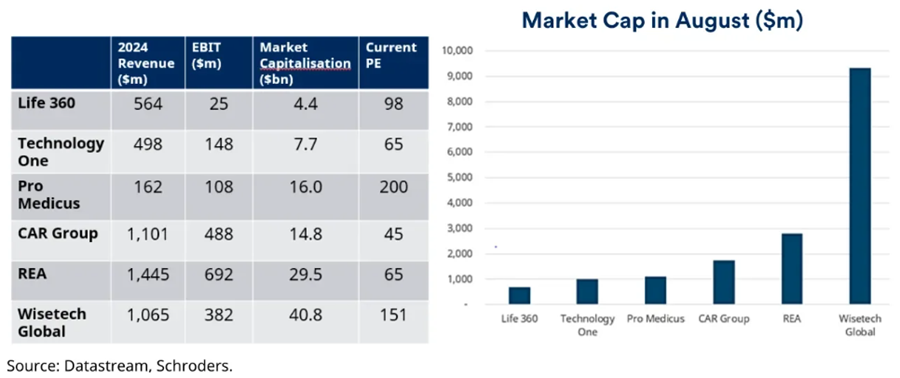
Banks have also been bid up. Possible reasons for this include ever-increasing superannuation and ETF flows into the sector and cash exiting the depressed mining sector and into banks.

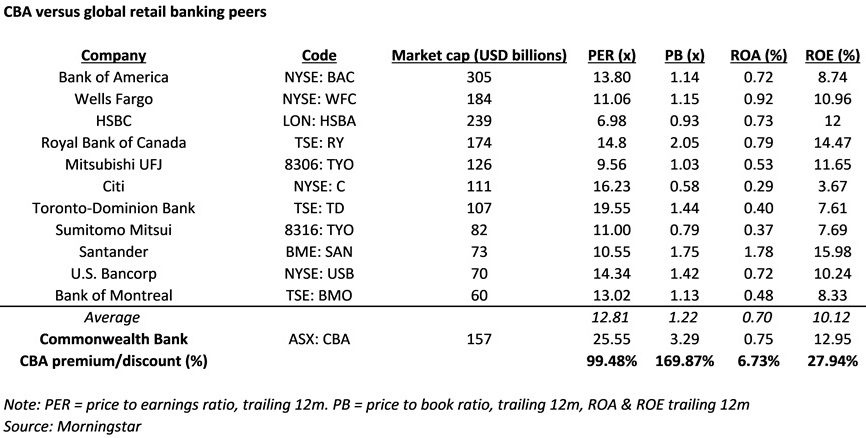
It’s left financials sector valuations on par with the ASX 200. That’s unusual as banks traditionally trade at a discount to the index due to them being cyclical and selling highly commoditized products.

Note that the bank’s steep valuations can be primarily attributed to the otherworldly pricing attached to Commonwealth Bank (ASX: CBA). CBA is the most expensive retail bank in the developed world, and it’s not even close.

Meantime, the mining and energy sectors have been left behind. Yes, China is depressing demand in many commodities, with iron ore at the top of the least. However, supply remains constrained in several commodities, including copper, oil, and coal, and that augurs well for prices going forward.

While of these sectors, there are pockets of opportunity. Earlier this year, I wrote an article on 16 ASX stocks to buy and hold forever. It was a wish list – stocks to buy in future at the right price.

Of the stocks, there are four that currently offer value, albeit for different reasons:

  • ASX Ltd (ASX: ASX) – problems now with replacing Chess but still a superb business with multiple ways to win.
  • SkyCity (ASX: SKC) – casinos are hated, but therein lays the opportunity with this sound operator.
  • The Lottery Corporation (ASX: TLC) – brilliant business, and valuations are starting to look ok.
  • Washington H Soul Pattinson (ASX: SOL) – Its main businesses in New Hope, Brickworks and TPG should bounce back from cyclical issues.


James Gruber is editor of Firstlinks and Morningstar


21 Comments
RK
September 30, 2024

Some things that feed the Real estate market, and you may have more.

Low interest rates.
Dual household income. Ability to have higher mortgage.
Excessive immigration over the past.
High wages particularly fuelled by mining companies, which adds to the cost of building.
Superannuation redemptions.
The bank of Mum and Dad
The higher the wages the higher the mortgage affordability.

The lack of decentralisation policy by governments to regional areas where manufacturing industries could be established and promoted for long term employment opportunities.
The big debts are the problem not the interest rate at the moment.

And we can all think of many more!!

John
September 30, 2024

Do not allow the CGT Main Residence Concession to deceased estates - the concession is for the benefit of homeowners - not their beneficiaries. This will encourage home owners to sell as they mature, encouraging downsizing and releasing a lot of well serviced property in the established suburbs for redevelopment.

Dudley
September 30, 2024

"Do not allow the CGT Main Residence Concession to deceased estates":

Bead death tax: sell before death.

Bakker
September 29, 2024

To Dudley.

Classic..

Jeff
September 27, 2024

Thanks James

a couple of questions/comments...welcome your views

it would be good to "anchor" some of these market measures against some other broader macro thoughts

re long bonds ....in the long run nominal R= p+g in a "non-stotashtic" world....
Aust = 2.5%+ 2.25%= 4.75% +/- 1.5 % ..and US = 2%+ 1.75%= 3.75% +/- 1%...so look a bit expensive..putting aside varying risk premia

for the long term investor.....not concerned with short run volatility.... US equities...pricing in stronger long term growth (winner in AI, green and dirty energy, hot n cold wars, etc) than rest of world.....and current bonds yields may well be relatively expensive

1. what is the measure of global ex US stocks yield of over 7.4%? looks high...typically both developed world about 2%...EM world...%? and US 1-2%
2. do u have any views/measures of long term real bond rates?
3 do u have any view/measures of long term inflation expectations?
4 do u have any measures of long term (5 years or more) volatility?

James Gruber
September 30, 2024

Hi Jeff,

1. It's earnings yield (PER inversed) rather than dividend yields.
2. Not really, but at current levels, 1-1.5% would seem realistic.
3. No. Though 2. assumes 2.5-3% in Aus.
4. Good question - I don't on hand but will look around and get back if I find something.

Best,
James

James
September 27, 2024

Hi James,

Just curious, in the "International House Price-to-Income Ratios" graph all countries are about on par in the blue bar indication (All: 1987 or 1992) and then Australia and New Zealand became much more expensive, why is this? Interest rates have been low the world over. Is it a supply difference? Strange how it seems a peculiarly antipodean problem!

James Gruber
October 04, 2024

Hi James,

Undoubtedly supply has played a part. Though incentives to get people into housing in Aust and NZ would have been a factor here too.

Parts of Canada, like Toronto and Vancouver, have had similar issues too. Not just an antipodean thing, though there certainly has been a bigger boom down here.

Rod in Oz
September 27, 2024

Great point Steve ! It would certainly simplify things too. I know, I'm doing the application for aged pension now...

ashley owen
September 26, 2024

james - love your work - but your leading chart has really got me confused!
Eg. you have made 'Yield' mean at least FIVE completely different things. eg. 'Yield' on cash and TDs is the actual cash received by the investor, which is correct. But Property rental 'yield' looks like median gross rental income before you lose 20-30% of it in expenses (and that ignores interest expense). Your 'Yield' on bonds looks like you are using yield to maturity which is the IRR of the cashflows only if you hold the thing to maturity. For your 'Yield' on the ASX you seem to be using 'earnings yield' (inverse of PER) which is based on rubbery profit numbers and assumes a theoretical 100% dividend payout rate which never occurs in real life. But for 'yield' on US/global shares it looks like you are using 'operating earnings', not actual reported after-tax profits (like you do for ASX), which adds even more moving parts and differences. A good comparison might be (a) cash yields for each and/or (b) total returns for each.
cheers
ao

James Gruber
September 27, 2024

Hi Ashley,

Yes, there are inherent limitations with the comparisons. I mention the limitations for real estate and run through the numbers. However, I haven't seen any reliable numbers for resi real estate of net yields, hence why I left it as a gross yield and ran through the flaws in that number in the text. For shares, I've taken the trailed PERs for all markets, based on reported numbers, and subsequent earnings yields.

Best,
James

Tim
September 26, 2024

Thanks for the article James, would you happen to know how much debt is attached to the residential property value?

James Gruber
September 26, 2024

Hi Tim,

Outstanding mortgage debt = $2.3 trillion. CoreLogic, where the chart is from, doesn't say whether that debt is included in the residential property value, but my assumption is that it is.

Best,
James

Paul
October 03, 2024

Great article James.. would be interesting to see the age cohort the $2.3 trillion in debt is attached to.. A fair assumption maybe between 25-55 years of age while the majority of the $8.5 trillion balance would be debt free within an older cohort..
is this overinvestment in Aus RE and corresponding underinvestment by/within business as reflected in sharemarket numbers why monetary policy is such a poor tool for affecting demand in aus?

Neil
September 26, 2024

“SkyCity (ASX: SKC) – casinos are hated, but therein lays the opportunity with this sound operator.
The Lottery Corporation (ASX: TLC) – brilliant business, and valuations are starting to look ok.”
I have always been intrigued by how a casino, poker machine or wagering company is considered negative on an ESG basis, but lottery companies are considered fine. Isn’t the expected loss on a lottery ticket flutter higher than all of the others?

david edwards
September 27, 2024

The key difference is the manipulative set-up of casinos to keep punters punting. Enclosed gambling environment, no clocks, whistles and bells, credit facilities nearby, croupiers gee-ing up the players... all calibrated to keep you on the premises. A wee flutter in yr own time at the local newsagent on a scratchie puts more control in the hands of the punter.

Neil
September 26, 2024

“Bonds also gives investors protection against economic downturns, which is something that cash doesn’t do.”
I don’t agree with this statement, but I may be missing something.
Economic downturns create huge opportunities for a contrarian to invest counter-cyclically. You can invest unless you have liquidity. Cash is the ultimate form of liquidity.
Further, cash will continue to earn a small yield and capital value is preserved (pre-inflation) which will be better than most other asset classes. Perhaps the comparison to bonds is true in that if interest rates are cut, the capital value of a bond will increase whilst the capital value of cash remains stable.

Peter
September 26, 2024

Your analysis of the over valuation in Australian real estate makes sense and lack of supply may be the main reason why prices do not adjust downwards. But despite extreme price to income ratios, buyers are still able to pay these over valued prices, I think this was due there being easy available credit which has now slowed with higher interest rates, but also existing home owners trading up (sell at high price taking advantage of increased equity and buy at high price with the same mortgage). The question is when first home owners can no longer afford to buy in to allow existing owners to trade up, will that be the trigger for a fall.

Steve
September 26, 2024

The solution is to move to the NZ system of no bureaucratic income or asset test for the aged pension. Then there is less reason to sit on an expensive home, simply to maximise the Centrelink Aged Pension. A lot of retirees would downsize immediately.

Kevin
September 28, 2024

Well Steve there are 2 things in life that people seem to confuse themselves with. One is reality,they refuse to see that. The other is dreams,they really want to believe in those.

As "they" say be careful what you wish for ( or dream ) ,you might get it.

NZ pension, single is NZ$ 31,546 ( gross ) after tax NZ$ 27,012. Far less than the Aus pension .

Married is NZ$ 23993 each ( gross) ,and NZ$ 20,778 each after tax.Far less than the Aus pension.Why would anybody have a dream of living in poverty.Then telling ( fooling ) themselves ,this is wonderful,the govt takes money off somebody else and gives it to me. You do of course need to contribute to pay as you go systems through your working life to qualify for that pension.This is where the govt took money off you to give to somebody else.

I would suggest you have a look around the world. All the pensioners are having a wonderful time. The cost of fuel for the Rolls Royce and the upkeep of the mansion can be a bit of a problem,but that was easy to solve. Take the RR out 3 days a week rather than every day ,saves a fortune in fuel,and keeps them in caviar and cucumber sandwiches on the lawn A good high tea snack,washed down with champagne of course Hang on !!!

Poverty,screaming why doesn't the govt give me more money,what about the cost of living crisis.I demand the govt gives me more money.I worked hard all of my life.

You work it out for yourself . The dream or the reality. Then demand the govt should take more money off somebody else and give it to you. "They" must pay more tax,and you shouldn't pay any tax.Then everybody will be better off .

Basically it all comes down to common sense,apparently that ain't common.

Dudley
September 28, 2024

"NZ$ 20,778 each after tax" = $A19,062

$A22,427.6 each after tax, https://www.servicesaustralia.gov.au/how-much-age-pension-you-can-get?context=22526

($A22,427.6 / $A19,062) - 1 = 17.7%

'The average cost of living in Australia ($2293) is 18% more expensive than in New Zealand ($1950).':
https://livingcost.org/cost/australia/new-zealand

NZ and Aus pensions same compared to cost of living [ simple arithmetic ].


Leave a Comment:


banner

Most viewed in recent weeks

An important Foxtel announcement...

News Corp's plans to sell Foxtel are surprising in that streaming assets Kayo, Binge and Hubbl look likely to go with it. This and recent events in the US show the bind that legacy TV businesses find themselves in.

Welcome to Firstlinks Edition 581 with weekend update

A recent industry event made me realise that a 30 year old investing trend could still have serious legs. Could it eventually pose a threat to two of Australia's biggest companies?

  • 10 October 2024

The quirks of retirement planning with an age gap

A big age gap can make it harder to find a solution that works for both partners – financially and otherwise. Having a frank conversation about the future, and having it as early as possible, is essential.

Welcome to Firstlinks Edition 578 with weekend update

The number of high-net-worth individuals in Australia has increased by almost 9% over the past year, and they now own $3.3 trillion in investable assets. A new report reveals how the wealthy are investing their money.

  • 19 September 2024

The everything rally brings danger and opportunity

Most market players today seek quick rewards and validation of opinion. Outsiders willing to combine new technology with old-fashioned patience and focused analysis can prosper.

The challenges of building a portfolio from scratch

It surprises me how often individual investors and even seasoned financial professionals don’t know the basics of building an investment portfolio. Here is a guide to do just that, as well as the challenges involved.

Latest Updates

Retirement

The quirks of retirement planning with an age gap

A big age gap can make it harder to find a solution that works for both partners – financially and otherwise. Having a frank conversation about the future, and having it as early as possible, is essential.

The everything rally brings danger and opportunity

Most market players today seek quick rewards and validation of opinion. Outsiders willing to combine new technology with old-fashioned patience and focused analysis can prosper.

Investment strategies

Portfolio construction in the real world

Building a portfolio is like building a house. This framework can help you move towards your goals without losing sight of reality or leaving yourself vulnerable to market storms.

Shares

Feel the fear and buy anyway

In this extract from his new book, the co-founder of Intelligent Investor reveals how investors can avoid critical mistakes and profit from opportunities in collapsing share prices.

Investment strategies

The risks of market concentration and not staying invested

MFS chief investment officer and CEO elect Ted Maloney talks market risks, similarities between Trump and Harris, and the most important thing investors can do to avoid destroying value.

Gold

Gold's important role as geopolitical tensions rise

Equity markets have traditionally struggled at times of sustained geopoltical tension. Gold, on the other hand, has thrived and can provide investors with protection against "unknown unknowns".

Strategy

The changing face of finals footy and the numbers behind it

A well-meaning AFL rule change in 2016 seems to have had unintended consequences. The top teams might cry foul but AFL bosses are unlikely to be too miffed about the outcome.

Sponsors

Alliances

© 2024 Morningstar, Inc. All rights reserved.

Disclaimer
The data, research and opinions provided here are for information purposes; are not an offer to buy or sell a security; and are not warranted to be correct, complete or accurate. Morningstar, its affiliates, and third-party content providers are not responsible for any investment decisions, damages or losses resulting from, or related to, the data and analyses or their use. To the extent any content is general advice, it has been prepared for clients of Morningstar Australasia Pty Ltd (ABN: 95 090 665 544, AFSL: 240892), without reference to your financial objectives, situation or needs. For more information refer to our Financial Services Guide. You should consider the advice in light of these matters and if applicable, the relevant Product Disclosure Statement before making any decision to invest. Past performance does not necessarily indicate a financial product’s future performance. To obtain advice tailored to your situation, contact a professional financial adviser. Articles are current as at date of publication.
This website contains information and opinions provided by third parties. Inclusion of this information does not necessarily represent Morningstar’s positions, strategies or opinions and should not be considered an endorsement by Morningstar.