I am a reluctant writer on Australian real estate because the sector doesn’t need more promotion. It gets enough of that from quacks and lobbyists that fill the daily newspaper columns and broadcast airwaves.
Yet I can’t help but notice a large gap in the coverage. There’s lots of news about housing prices, clearance rates, ‘hot’ suburbs, interest rates, and where to get the best loan. There’s much less about property values, or valuation. It’s a curious omission.
After all, there’s constant talk of valuations when it comes to stocks, bonds, and other assets. The price-to-earnings ratios for stocks are regularly spoken of, as are the yields on bonds.
For residential property, not so much. Why is that? Perhaps, valuations on housing don’t matter. Or maybe they don’t fit the uniformly bullish commentary on the sector.
I’m going to suggest that valuations do matter and they’re little mentioned because housing remains ludicrously priced. Up to 40% overpriced in my estimate. And that housing here is far more expensive than the ‘Magnificent Seven’ US tech stocks, which are richly valued yet have infinitely better growth prospects.
I’ll also argue there are very high odds that returns from the ASX will handily beat those from residential property over the next 10 and 20 years.
The maths on property valuation
How do you value a property? Commercial property valuers will tell you that valuations are based on the discounted cashflows generated from an asset. The reality is a lot of valuations are based on capitalization rates – net operating income divided by market value – or price-to-book values from recent transactions.
In residential property, it gets murkier. Valuations aren’t based on land value. They’re not based on cashflows. They’re not based on book values. In my experience, they’re largely based on recent transactions in the neighborhood.
The problem with this is that current prices or recent transactions tell you nothing about the value of a property. It’s like saying that the current price for the stock market equates to fair value of the market – because prices equal fair value. It’s a circular argument that doesn’t make sense.
How do we value the Australian residential market, then? One possible method is to take the so-called risk-free rate of return and apply a premium to reach a fair value estimate. The 10-year Australian Treasury yield is generally regarded as the risk-free. It’s regarded as risk-free because you loan the Government money and are guaranteed (in theory) to get your money back in full. As I write, the 10-year yield stands at 4.11%.
All other assets are priced off this risk-free rate. For taking the risk of owning an asset, an investor will demand a premium to that risk-free rate. The extent of the premium is open to debate.
The advantage of this method is that we can compare yields and risk premiums across different assets. Below is an updated chart from a recent article in Firstlinks.
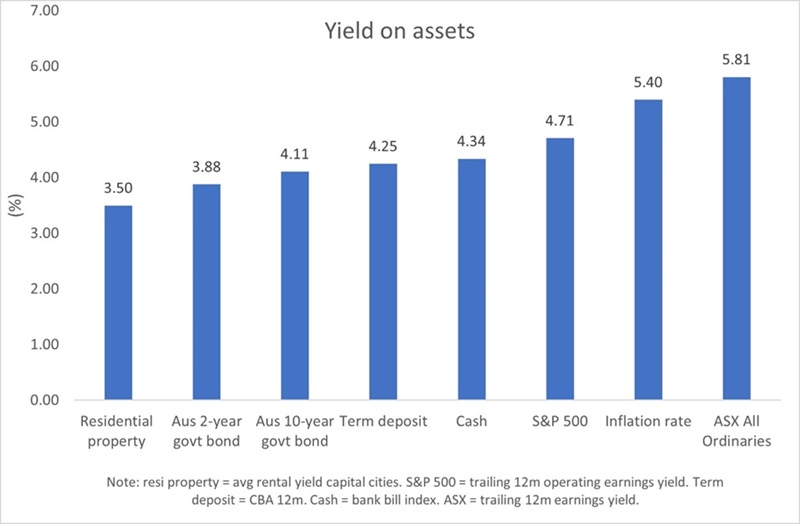
Form the chart, you’ll see that the yield on residential property is well below the 10-year Government bond. It’s also below what you can get from cash and a term deposit. And it’s way lower than the current inflation rate.
It doesn’t tell the full story though. The yield on residential property is based on a gross yield. It’s before taxes and costs. That’s not the case for the ASX and S&P 500, for instance. So, the chart isn’t a like-for-like comparison.
What premium to the risk-free rate should housing command? There’s no hard and fast rule. Stocks generally trade at 1.5-3% above the risk-free rate. Commercial property can be +3%.
Given housing is less risky than stocks or commercial property, a risk premium of close to 1.5% seems appropriate. That would put residential property on a gross yield of 5.61% (risk-free rate of 4.11% plus the risk premium of 1.5%). And it would fair value for housing at 40% lower than current prices.
Does this fair value make sense? Let’s cross-check it against other valuation tools.
Valuation sanity checks
Perhaps an easier way is to look at it from a price-to-earnings ratio (PER) basis. At a 3.5% gross yield, property is currently on a PER of 29x. Though that’s not quite accurate as the earnings are gross earnings not net earnings. Applying a 30% tax rate (which is the tax rate on an average salary) to those earnings would increase housing’s PER to 40.8x. That’s more than double the valuation of the ASX All Ordinaries 17x PER and almost 2x the S&P 500’s 21x PER.
That doesn’t paint the full picture, either. That’s because that PER is before costs, and maintenance costs for property can quickly add up. Input those costs and the PER for property is easily north of 50x.
The ‘Magnificent Seven’ technology stocks in the US are priced at 33x forward earnings. Therefore, it can be argued that Australian property is priced at a far higher multiple than these stocks, which themselves are regarded as richly valued albeit with vastly superior growth prospects.
At our fair value estimate, housing would be valued at a PER of 17.8x (the inverse of a 5.61% yield). Again, though, that’s based off a gross yield. Applying a 30% tax rate to housing earnings would lift the PER to 25.5x. That would equate to a 50% premium to the ASX’s PER. That’s a sizeable premium though not unreasonable.
Why Australian housing is so richly valued?
Housing is incredibly expensive even compared to other countries. The 2023 Demographia Affordability Survey says the median multiple of house prices to income for major cities is 8.2x in Australia versus 5x for the US and UK. In Sydney, it’s more than 13x. And the time it takes for someone on a full-time wage to save for a 20% housing deposit has doubled from 5 to 10 years since the 1990s.
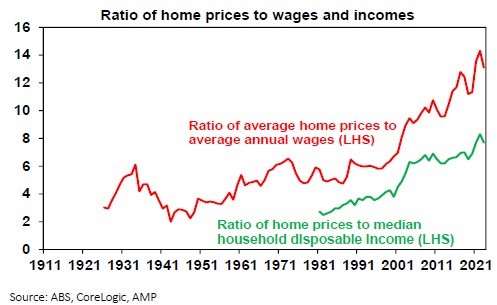
The question is why have prices become this expensive? Looking at the chart above, it’s really since the 1980s that prices have taken off.
What changed then, and since? One obvious answer is that from 1980 to 2022 we had falling interest rates. I’d argue it was more than that though. Especially over the past 15 years, the RBA and central banks around the world kept interest rates below the rate of inflation, otherwise known as financial repression. This stoked speculation across most assets and resulted in an enormous increase in global debt. It also led to the ‘financialization’ of economies, where capital flowed into financial assets at the expense of real assets (think of the lack of infrastructure spend in Australia, for example).
Interest rates can’t be the sole reason for expensive housing here because it doesn’t explain why Australian property has steamed ahead of most other countries.
Supply issues have undoubtedly played a role. Up until around 2006, the market was roughly in balance, where there was enough supply to meet demand. Since then, there’s been a persistent shortfall. Currently, the shortfall is around 120,000 dwellings, and that’s expected to increase over the next few years.
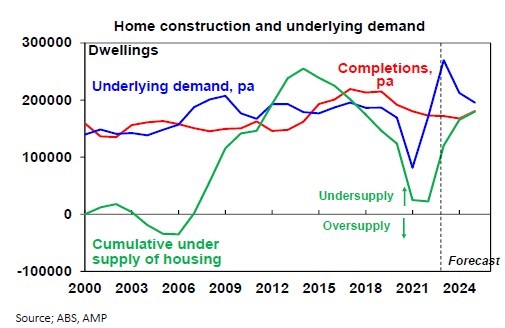
The reasons for the supply shortfall are many. From a lack of development approvals combined with the rise of NIMBYs (not in my backyard) to capacity constraints to, lately, construction firms struggling to stay afloat amid cost pressures.
The Federal Government has heard the message and is targeting to build 1.2 million new homes over five years from 2024. Over the past five years, we’ve built around 1 million new homes, so this isn’t a significant step up, and is unlikely to be enough to stem the supply shortfall.
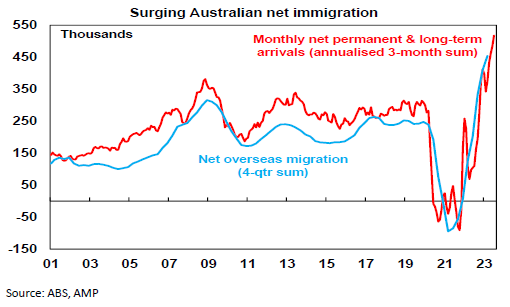
On the demand side, surging immigration has played a part. In the early 2000s, net migration averaged 100,000-150,000. That surged to 518,000 in the year to June 2023. Part of that was a catchup from the pandemic, but net overseas migration has been at high levels since 2006.
Demand has also been fuelled by massive government subsidies. Whether it’s first homeowners’ grants, negative gearing, or capital gains tax concessions, all have helped to propel demand and prices.
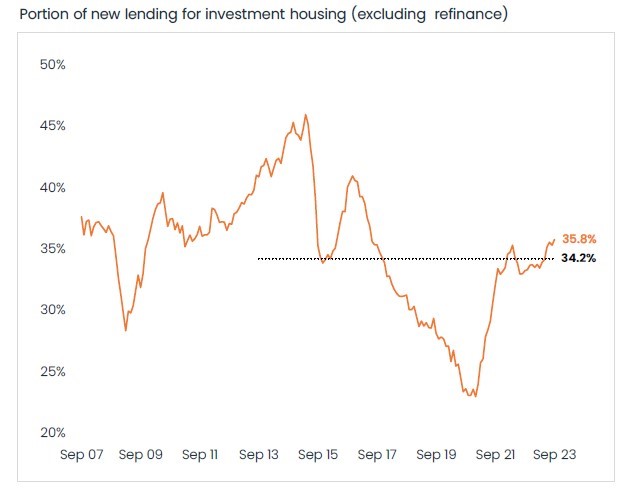
What’s little talked about is the staggering number of individual investors in the housing market. It’s somehow considered normal here that 36% of new housing loans go to investors. In the US, that share of loans to individual investors is about half of Australia’s.
Source: CoreLogic
I have friends and acquaintances who’ve purchased investment properties well before they bought their own homes, some that own two investment properties and don’t own their own home (and have recently moved back into their parent’s place), and several others with average paying jobs who own multiple investment homes. And all of them are loaded to the gills with debt.
The fact that investors are willing to buy houses that are almost guaranteed to lose them money on a cash basis (for instance, the average CBA variable loan at 6.5% exceeds the average capital city rental yield of 3.5%) shows you the power of government subsidies and the optimism about future returns.
Future returns
How about the future returns of property versus shares? It’s difficult to estimate short-term returns though much easier to predict long-term ones.
To calculate the potential returns over a 10-year timeframe, we can use the following formula:
Starting net yield + earnings growth rate + % change in earnings multiple
For property, the starting net yield is 2.45% (this is before costs, which are difficult to calculate and are therefore subjective). What would we assume for rental earnings growth? Though rent has ballooned over the past two years, during the 2010s, average rent growth was 2%. In the long-term, we’d assume that it heads back towards that rate. Let’s assume 2.5% annual rental growth.
If there was no change to the earnings multiple, that would give you an annual nominal return for housing of 4.95%.
Predicting no multiple change is a big assumption. Remember, housing is currently priced at a PER of 40x before costs. If we assumed a 25% haircut to the multiple, that would reduce annual returns to 3.71%.
We can assume different rent growth rates and multiples to come up with different estimates. I would suggest a range of 2-5% in annual returns over the next 10 years is reasonable.
Let’s apply the same formula to estimate stock returns over the next decade. The current dividend yield on the ASX is 4.44%. A conservative earnings growth estimate is 3% per annum. Given the current PER is almost bang in line with the long-term average, let’s assume no change in the multiple. That gives you an annual return of 7.44%. I consider this conservative.
Again, we can play around with earnings growth estimates and dividend yields (possible cuts?) and the earnings multiple. I would put the range of future annual returns is 6.5-10% for the ASX All Ordinaries. For reference, ASX stocks have returned 7.3% per annum over the past 10 years.
Putting this together, I think the odds are very high that ASX stock returns will handily beat those from residential property over the next decade.
What are the chances of a meaningful housing correction?
Given the high prices for property, can we expect a larger correction at some point? I doubt it. In the near term, supply shortfalls are severe and that will keep prices up. Long term, it’s up to the Government to bring meaningful reforms to the sector to bring prices down.
But that isn’t going to happen. The Government has no desire for house prices to go down. It may talk about bringing on extra supply, and doing other things around the fringes, but it has no intention for property prices to fall.
To understand why isn’t hard. The average parliamentarian owns multiple investment properties. Also, 67% of the population are homeowners.
As Charlie Munger once said, “Show me the incentive, and I’ll show you the outcome”.
The Government could remove all subsidies for housing and prices would quickly drop. But major changes won’t come until they’re incentivized to do it. And that won’t happen until the majority of voters aren’t homeowners. When that occurs, the political calculus will change.
James Gruber is an assistant editor at Firstlinks and Morningstar.com.au