Register For Our Mailing List

Register to receive our free weekly newsletter including editorials.

Home / 563

Big Super’s asset allocation and future headwinds

There has been a lot of talk about how the asset allocations of large super funds have switched away from public assets to private. The evidence suggests that the change hasn’t been dramatic.

We also look at how there are some headwinds that may affect future long-term performance of Big Super, as demonstrated in the charts below.

Asset allocation changes overplayed
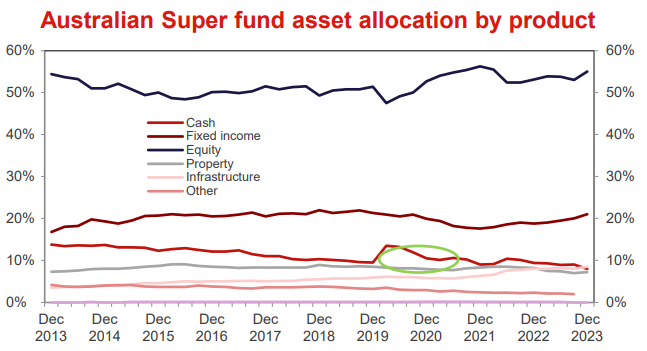

Source: Westpac

This first chart came from a Westpac report, and it was a surprise to us. There's been endless talk about how big Super is embracing alternative assets. But it's mostly talk. The chart shows aggregated Super Fund asset allocation over the past decade. Everything looks pretty much like it did in 2013. Despite super fund Chief Investment Officers, (who are now the apex predators in the investment industry food chain; $1 million+ salaries and not much accountability), talking a good book, they didn't do much last decade. They sold a few bonds when bond rates were less than 2% and threw a bit more at infrastructure (which kind of resembles bonds plus a bit of inflation), but that was about it.

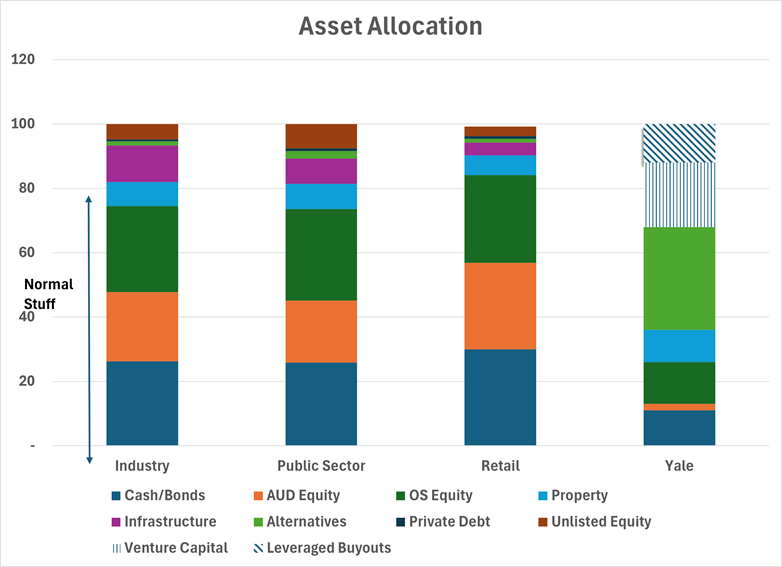
The second chart shows the asset allocation of the various types of superannuation funds, and they are all a bit same same-ish. Industry funds have a bit more infrastructure than other super funds, but it is largely still the normal assets (the bottom four boxes in the chart) that any investor can easily access. Scared of underperforming peers? Who knows? It's hard to believe this is every CIO's idea of unconstrained asset allocation.

On the far right we have shown the allocation of the Yale University Endowment Fund. That shows what a non-peer aware asset allocation looks like. Big chunks in non-traditional assets and they include a decent slab of commodities and forestry.

What is the best asset allocation?

It is a genuinely tough question, but what is the right asset allocation for long term super funds?

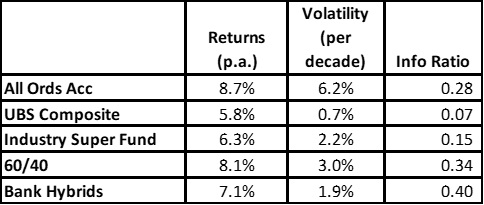
In the table we have calculated the 10year return/risk/information ratio (a measure of how much bang you get for your risk buck) for each year since 1994 (i.e the 1994 cohort reflected the returns/risk for the next decade. For the 60/40 and Industry super funds we rebalanced at the start of every year. The last cohort is from 2014 to 2024.

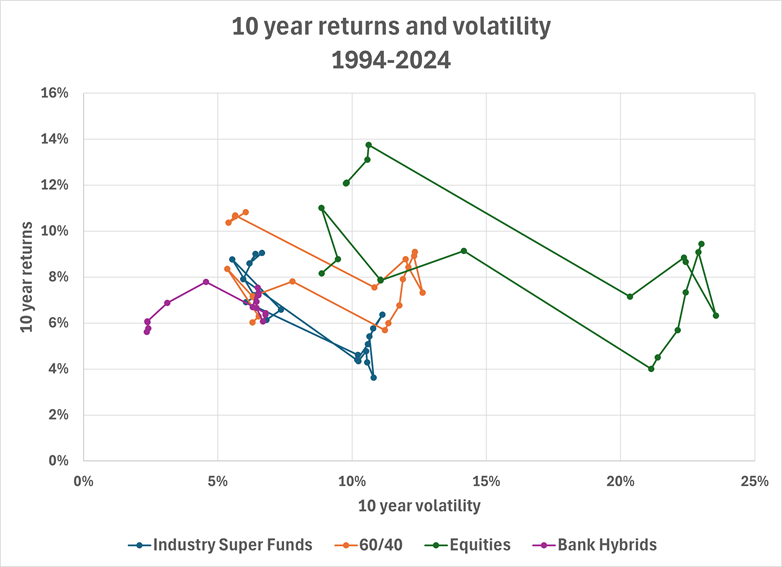
The chart shows risk and return for each of the 10 year periods since 1994 (ie decade commencing 1995, 1996 etc).

So, what does it tell us?

  • Equities do best, but there are some messy decades. You probably wouldn't want to have a pure equities portfolio in the 10 years before retirement because there's a reasonable chance you only get 4% and lots of heartburn.
  • The 60/40 portfolio outperformed the current Industry Super fund asset allocation. That is at least partly due to the big fall in bond rates (and Industry Funds aren't big on bonds).
  • Hybrids are an example of what being a bit more adventurous can do. Returns are decent, not much risk and not much volatility of volatility (i.e) it is always low volatility. The Hybrid information ratio is materially higher too.

What does the future look like?

Super Funds have generated mid to high single digit returns over a decade holding period for the last 30 or so years. That has been comfortably above inflation. Are we going to see this over the next decade?

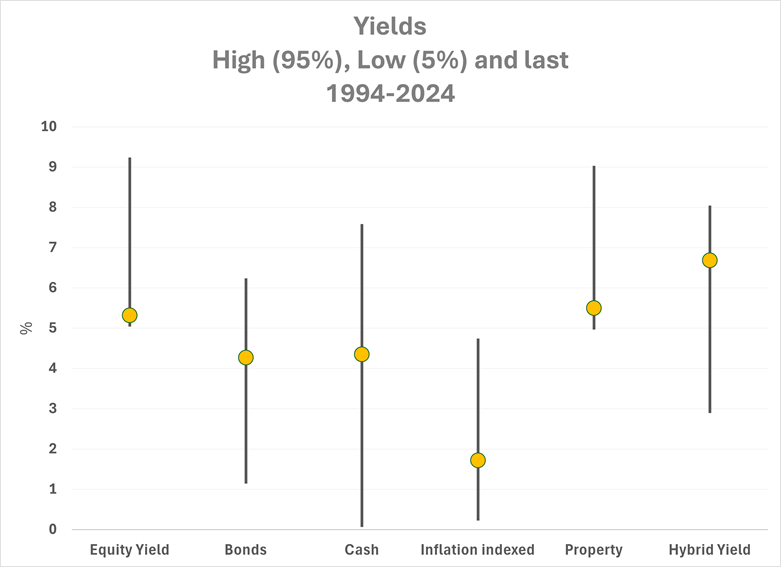
The top chart shows the current yields of some of the asset classes since 1994. We were surprised that current bond and cash rates are close to three-decade averages (we thought the average would be higher), but even so, it's only around 4%. You need other asset classes to generate more than that to get your 7%. That might be a big ask. Equity yields (based on current PE's) are very low in comparison to the last 30 years. Of course, they can get to 7% returns if there is lots of profit growth or PE expansion, but maybe that doesn't happen. Property is even worse. It is still expensive in historical terms, and we can't see rental growth saving it. And yields are at historically small margins to bond yields, so you need to see bond yields fall to get capital gains.

It's our newsletter so of course we have to give hybrids a plug. Margins might be historically tight but the yields of around 7% are top quartile since 2000. Volatility is muted unless there is material equity weakness.

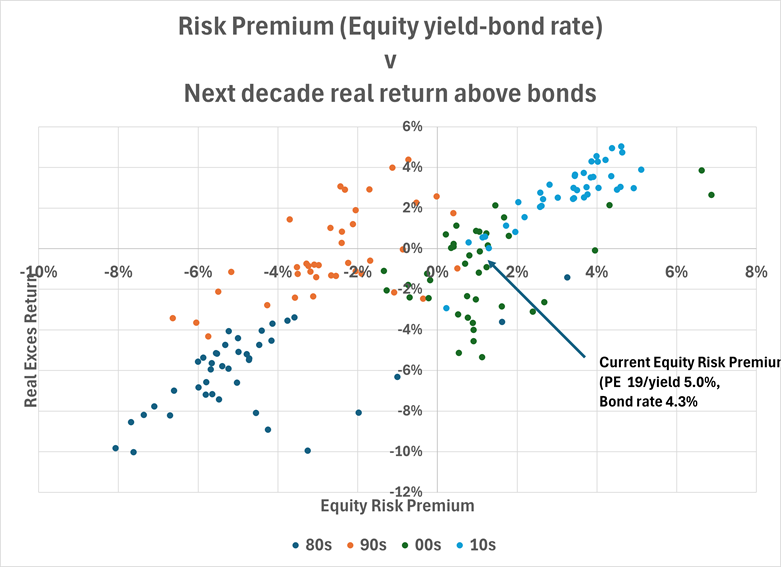
Buying equities when they are cheap should make any fund manager look like a genius. In the bottom chart we have tried to test that concept. We've taken the Equity Risk Premium (the equity yield less the bond yield - horizontal axis) each quarter since 1980 and calculated the real return of the All Ords (accumulation) less the starting bond rate (vertical axis). We've have shown the results for each of the decades as well. So, the 1980s were painful. High inflation meant relatively low real returns for equity markets and bond yields were high. That's why they are all in the bottom left-hand quadrant.

You would expect when you buy equites cheap (i.e when they show much higher yields than bonds) that you would generate higher return outcomes. That is largely true, and you can draw upward sloping lines for all decades (except the 1990s). It's not infallible though. Most worrying is that compared to recent decades, this is a seriously expensive equity market. It doesn't mean that equities are guaranteed to underperform but they are building in historically high levels of EPS growth to justify the valuation.


Campbell Dawson is Managing Director of Elstree Investment Management, a boutique fixed income fund manager. This article is general information and does not consider the circumstances of any individual investor. Elstree's listed hybrid fund trades under ticker EHF1.


2 Comments
Jeff O
June 09, 2024

Agree - target is AUD returns - risk adjusted (and tax too) for long only ungeared. And agree - such (historical) analysis needs to add in global equities - given Australia is a concentrated small listed equity market (albeit a large unlisted/SME market). As for FI, Australian real yields are slightly higher and so to floating rates against DMs.

Re AUD, structural drivers are critical eg pre GFC AUD up yo over $1 USD driven by China's commodity dead....and now at 0.66 USD and similar (lowish) core inflation, the real AUD is close to equilibrium - take a look at RBA research and IMF's External Report.

So the move offshore by a minority of Australian investors from a concentrated Australian listed equity portfolio of largely banks + bulk resources + energy to overseas equities driven by other structural drivers - AI, India etc has been warranted and rewarded to date. (Noting that some - eg the Big Australian, CSL, RIO PME et al have large production and revenue sources offshore too.)

As for the future, place your bets - go AI, go green energy, go.....and make love not war - best hot, cold or with viruses!
And watch out for macro bubbles, bust, recoveries - if you play cyclical/timing/tactical AA positioning

John Abernethy
June 06, 2024

Thanks Campbell,

There is another future potential headwind called the AUD.

International assets have benefited greatly since 2014 when the AUD peaked above parity with the USD.

About 3% return pa has been generated over a decade from the depreciation of the AUD.

As FUM has grown inside Industry Funds there is growing allocation to offshore assets which are predominately USD. Recent reports and commentary suggest that some funds are allocating 70% on net investment flows to offshore as Super assets grow faster than GDP and investment opportunity.

This is a feature in a period where accumulation funds are growing (contributions) faster than pension funds (pay outs). It also magnifies asset returns from offshore (over the last 10 years) when the AUD is depressed by the constant investment offshore flows - sell AUD.

The interesting point is that the AUD has been depressed despite the best economic indicators in the developed world - occasional fiscal surplus, trade surplus, capital account fairly balanced, low government debt to GDP, population growth. In my view monetary manipulation (offshore) and the excessive international investment flows has caused the devaluation of the AUD and the resultant imported inflation.


Leave a Comment:

RELATED ARTICLES

Is your industry super fund too illiquid for its safety?

The super wars revisited: Vanguard vs AustralianSuper

Darryl and Sal Kerrigan are now private equity investors

banner

Most viewed in recent weeks

How much do you need to retire comfortably?

Two commonly asked questions are: 'How much do I need to retire' and 'How much can I afford to spend in retirement'? This is a guide to help you come up with your own numbers to suit your goals and needs.

Meg on SMSFs: Clearing up confusion on the $3 million super tax

There seems to be more confusion than clarity about the mechanics of how the new $3 million super tax is supposed to work. Here is an attempt to answer some of the questions from my previous work on the issue. 

The secrets of Australia’s Berkshire Hathaway

Washington H. Soul Pattinson is an ASX top 50 stock with one of the best investment track records this country has seen. Yet, most Australians haven’t heard of it, and the company seems to prefer it that way.

How long will you live?

We are often quoted life expectancy at birth but what matters most is how long we should live as we grow older. It is surprising how short this can be for people born last century, so make the most of it.

Australian housing is twice as expensive as the US

A new report suggests Australian housing is twice as expensive as that of the US and UK on a price-to-income basis. It also reveals that it’s cheaper to live in New York than most of our capital cities.

Overcoming the fear of running out of money in retirement

There’s an epidemic in Australia that has nothing to do with COVID-19, the flu, or the respiratory syncytial virus. This one is called FORO, or the fear of running out of money in retirement, and it's a growing problem.

Latest Updates

Investment strategies

The iron law of building wealth

The best way to lose money in markets is to chase the latest stock fad. Conversely, the best way to build wealth is by pursuing a timeless investment strategy that won’t be swayed by short-term market gyrations.

Economy

A pullback in Australian consumer spending could last years

Australian consumers have held up remarkably well amid rising interest rates and inflation. Yet, there are increasing signs that this is turning, and the weakness in consumer spending may last years, not months.

Investment strategies

The 9 most important things I've learned about investing over 40 years

The nine lessons include there is always a cycle, the crowd gets it wrong at extremes, what you pay for an investment matters a lot, markets don’t learn, and you need to know yourself to be a good investor.

Shares

Tax-loss selling creates opportunities in these 3 ASX stocks

It's that time of year when investors sell underperforming stocks at a loss to offset capital gains from profitable investments. This tax-loss selling is creating opportunities in three quality ASX stocks.

Economy

The global baby bust

Across the globe, leaders are concerned about the fallout from declining birth rates and shrinking populations. Australia, though attractive to migrants, mirrors global birth rate declines, and faces its own challenges.

Economy

Hidden card fees and why cash should make a comeback

Australians are paying almost two billion dollars in credit and debit card fees each year and the RBA wil now probe the whole payment system. What changes are needed to ensure the system is fair and transparent?

Investment strategies

Investment bonds should be considered for retirement planning

Many Australians neglect key retirement planning tools. Investment bonds are increasingly valuable as they facilitate intergenerational wealth transfer and offer strategic tax advantages, thereby enhancing financial security.

Sponsors

Alliances

© 2024 Morningstar, Inc. All rights reserved.

Disclaimer
The data, research and opinions provided here are for information purposes; are not an offer to buy or sell a security; and are not warranted to be correct, complete or accurate. Morningstar, its affiliates, and third-party content providers are not responsible for any investment decisions, damages or losses resulting from, or related to, the data and analyses or their use. To the extent any content is general advice, it has been prepared for clients of Morningstar Australasia Pty Ltd (ABN: 95 090 665 544, AFSL: 240892), without reference to your financial objectives, situation or needs. For more information refer to our Financial Services Guide. You should consider the advice in light of these matters and if applicable, the relevant Product Disclosure Statement before making any decision to invest. Past performance does not necessarily indicate a financial product’s future performance. To obtain advice tailored to your situation, contact a professional financial adviser. Articles are current as at date of publication.
This website contains information and opinions provided by third parties. Inclusion of this information does not necessarily represent Morningstar’s positions, strategies or opinions and should not be considered an endorsement by Morningstar.