Any day soon, perhaps now, the Australian Exchange Traded Fund (ETF) sector will exceed $100 billion. It’s a remarkable rise. It started 2020 at $62 billion, giving an increase of over 50% in a year. In the last decade, ETFs have moved from marginal usage by specialist advisers into mainstream investments, with 215 products listed on the ASX and another 11 ETFs and QMFs on Chi-X.
As well as strong inflows into ETFs, the rapid rise was boosted in December 2020 by the conversion of Magellan’s Global Fund to an ‘open class’ which allows applications and redemptions on and off market, and this change contributed $13.5 billion. Without this injection, the increase was still an impressive 32% over the calendar year, taking the compound annual growth since 2001 to 46%, as shown in the chart below.
Total funds under management in Australian ETFs, April 2001 to December 2020
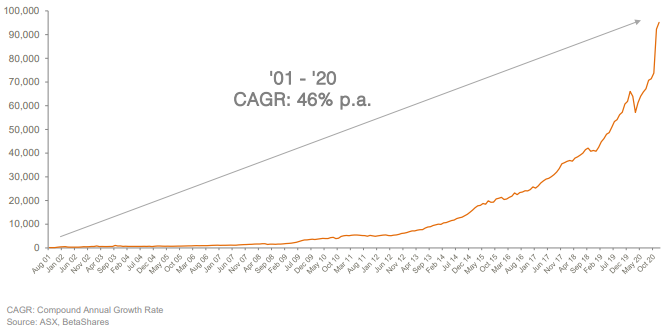
Equally impressive is the fact that the increase did not rely on market movements, as the S&P/ASX200 was flat over 2020. About $20 billion of new money was invested in ETFs over the 12 months, driven by thousands of individual investors including younger people using the stockmarket for the first time. Among the ETF issuers, both Vanguard and BetaShares reported records of over $5 billion in annual net flows each.
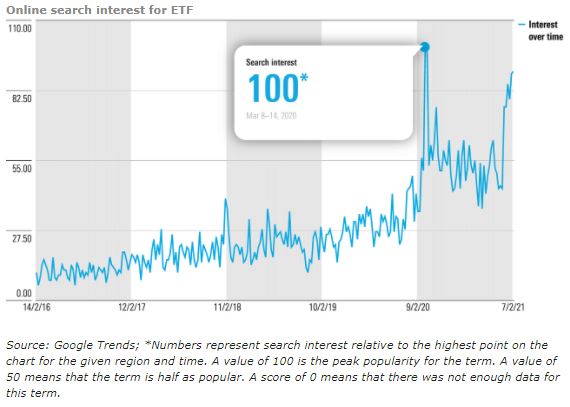
Google Trends shows the search interest in ETFs hit a peak during the height of the pandemic in March 2020, and surged again recently while maintaining significantly higher levels than in 2019.
Five reasons for the success of ETFs
1. Popularity of index funds to reduce costs
Notwithstanding the ability of active fund managers to attract investors and in some cases outperform the market, about 90% of ETF flows go into passive or index funds. There are two main reasons: first, they are cheaper, such as the BetaShares Australia 200 ETF (ASX:A200) which is the cheapest Australian equity fund with a management fee of 0.07% a year, or Vanguard’s US Total Market Shares ETF (ASX:VTS) at 0.03% which tracks an index of about 3,500 US companies.
In addition, there is strong evidence that most active managers fail to outperform the index after fees over time. S&P’s SPIVA Australia Scorecard reports on the performance of active funds against their respective benchmarks over different time periods, evaluating over 900 equity funds in large, mid, and small cap categories as well as 463 international equity funds. Although some dispute the analysis, the latest report shows 92% of global equity managers are outperformed by the index over 10 years, and 82% of Australian equity funds.
Investors are increasingly asking if it is worth paying for active management, and these index-tracking funds continue to hold their market share of ETFs, as shown below (source: BetaShares).

While the broad index ETFs attract the largest flows, some sectors such as gold and tech also did well in 2020, as this table shows.
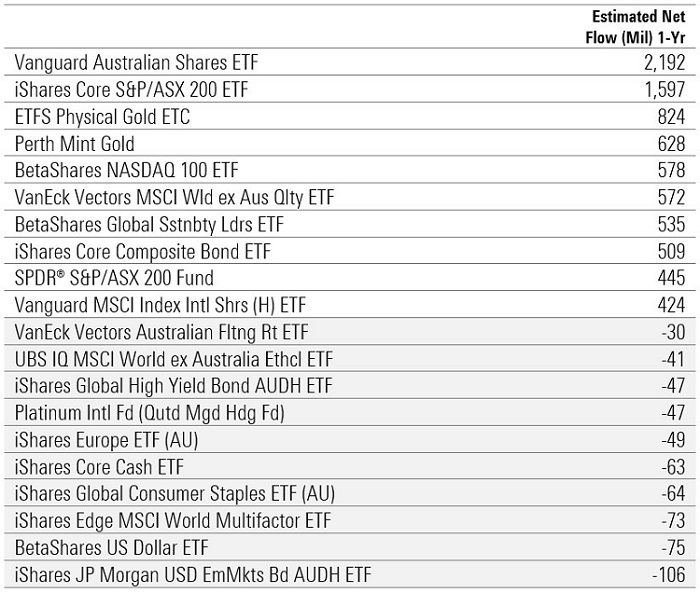
Source: Morningstar Direct.
2. Desire for international investments
Like most investors around the world, Australians traditionally invested with a heavy domestic bias. This was encouraged by the franking credits generated by Australian companies, and the popularity of Australian businesses such as the big banks, Telstra, Woolworths, BHP and Wesfarmers.
However, Australians have realised that with 98% of companies by market value listed outside the country, including global tech leaders such as the FAANGs (Facebook, Apple, Amazon, Netflix, Google), a greater diversity of sectors and better exposure to the world’s leading companies is needed.
Although global investments also occur directly into companies listed on foreign exchanges and through unlisted funds, global ETFs are major beneficiaries of this broader appetite. In 2020, international equities received the highest level of inflows of any asset category, at about $7.6 billion, ahead of Australian equities at $6.8 billion, as shown below (source: BetaShares).

3. Rise of thematic funds
While major indexes attract the bulk of flows, sector-specific funds allow investors to back themes which are benefitting from changes in global trends. There is a wide range of ETFs which gives exposure to sectors such as gold, tech, robotics, commodities, agriculture, currencies, property, infrastructure and cybersecurities.
In 2020, 38 new products were launched across all categories. The year also delivered some big sector and theme winners and losers. Inevitably, the extreme ups and downs are among the special themes rather than the broad indexes.
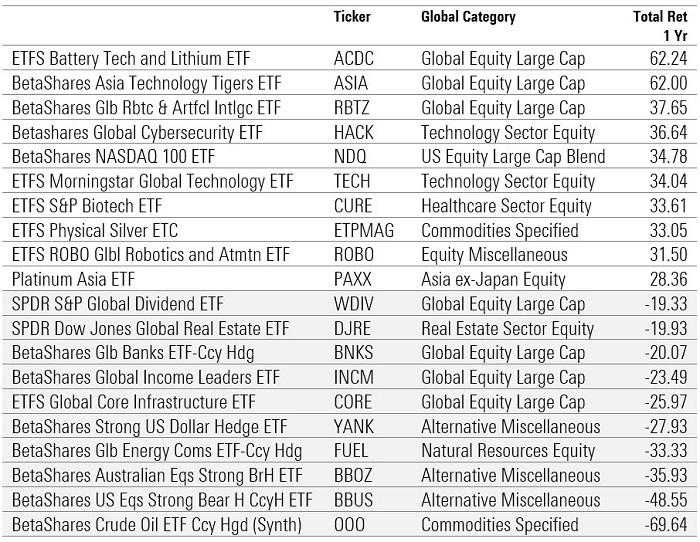
Source: Morningstar Direct.
4. Development of Active ETFs
ETFs have become a viable alternative to unlisted managed funds and Listed Investment Companies for many fund managers. It is likely that leading managers will increasingly use these vehicles and they will gradually build market share, with the likes of Munro Partners and Hyperion following up their good 2020 results with new Active ETFs.
Existing issuers include Fidelity, Schroders, Vanguard and Legg Mason. Volumes will be boosted by existing unlisted managed funds converting to listed, open-ended structures, and Chi-X recently launched a range of lower cost Magellan funds in a 'core' series.
5. Preference for listed vehicles
The unlisted managed fund industry has never succeeded into streamlining its direct investing application processes. While it is possible to access unlisted funds via a platform, and these are popular especially for consolidating investments and reporting, platforms come with additional fees at a time when informed investors are looking to minimise costs. Additionally, improved portfolio management software gives HIN-based listed investments much of the functionality of platforms without the cost.
Most unlisted application processes are stuck in the dark ages, especially for SMSFs. They require certified copies of trust deeds, identification of directors and completion of a long application form. The FATCA identification process adds more compliance, and each unlisted fund is supported by a unique website with logins and passwords.
Younger investors find the simplicity of one signup with an online broker appealing, with ready access to hundreds of funds and thousands of companies at their fingertips. The more advanced platforms are now HIN-based pushing more investing online.
The stalling of LICs and LITs
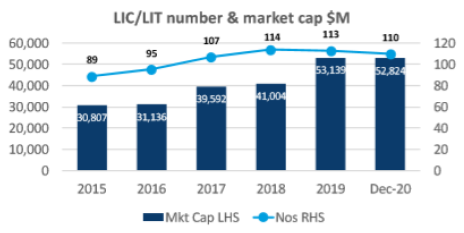
As recently as a couple of years ago, in 2018, the ETF and LIC/LIT sectors were about the same size, around $40 billion. LICs have a history of almost 100 years and previously dominated the listed fund space. However, much of the LIC/LIT demand was driven by commissions paid by issuers to advisers and brokers, under an exemption from the Future of Financial Advice (FoFA) laws introduced in 2012 which prevented advisers from receiving a commission from product manufacturers. However, this exemption was removed in 2020, and there have been no new transactions for a year. As shown in the chart below, LIC/LIT balances have stagnated.
LIC/LIT market capitalisations and number to December 2020
Source: Listed Investment Companies & Trusts Association (LICAT).
It remains to be seen whether LICs and LITs can come again. Their closed-end structure gives fund managers committed capital and they do not need to sell assets to meet redemptions, especially in times of market disruption. This has advantages for less liquid asset classes such as private debt or non-investment grade bonds.
However, prices can drift into heavy discounts to the value of the underlying assets if demand falls away. Issuers have been unable to attract enough buyers for new transactions without paying commissions to brokers and advisers. For now, most active managers are adopting the ETF structure for new transactions.
Graham Hand is Managing Editor of Firstlinks. This article is general information and does not consider the circumstances of any investor.