Register For Our Mailing List

Register to receive our free weekly newsletter including editorials.

Home / 559

How retiree spending plummets as we age

This is an extract from an article originally published on Actuarial Digital.

In my experience, there have been many discussions on an appropriate method to determine an initial level of spending. However, there has been little debate about how retirement spending may change as individuals progress through the active, passive, and frail stages of retirement. I believe this is an equally important consideration when it comes to retirement planning as it could have a significant impact on the level of savings required at the point of retirement.

Defining retirement spending categories

To understand how spending may change in retirement, let’s first consider categorising spending into different segments, such as:

  • Clothing and Appliances
  • Eating and Drinking Out
  • Grocery and Food
  • Health
  • Housing Expenses (excluding rent and mortgage)
  • Leisure and Entertainment
  • Other
  • Cash withdrawals
  • Transportation
  • Travel
  • Utilities and Finance

It is essential to acknowledge that the amount a person allocates to each category at the onset of retirement is likely to change as they progress throughout their retirement years.

The evolution in spending may be influenced by the various stages in retirement: active, passive and fragile.

During the active phase, individuals may allocate a larger proportion of their expenses to travel, transportation, and leisure activities, which may decrease as they age. Conversely, certain expenses, such as healthcare, may increase as they grow older.

When assisting individuals to understand how their retirement spending might change during retirement, it’s crucial to comprehend their initial spending and potential adjustments. One approach is to examine how spending patterns correlate with an individual’s socio-economic status, as this may often reflect retirees’ lifestyle choices and spending tendencies.

Identifying retirement spending patterns

This section considers how spending in retirement varies for different age bands by analysing digital banking spending data from Australian individuals aged 60 and over.

This data was extracted from the Compare My Spend tool on the Spirit Super website.

It is important to note that the data looks at the spending of individuals at a single point in time across multiple age bands and it is not a longitudinal study looking at the spending of a single group of individuals as they progress throughout different ages.

The data is categorised by age bands (60-64, 65-69, 70-74, and 75+) and affluence levels (Low, Mid, Mid-High, and High). The affluence levels are defined based on individual spending on different categories and spending behaviour. This categorisation helps identify any distinct spending patterns that might be visible in the data.

Chart 1: Average retirement spending for different age bands (percentage change)
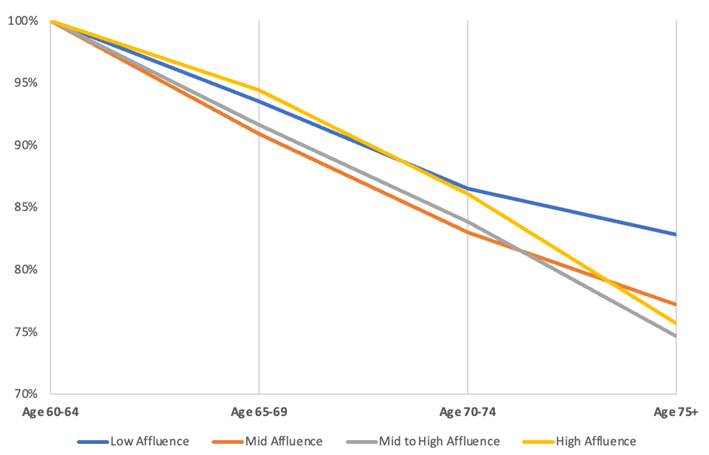
Using the 2022 banking spending data, the above chart looks at the percentage change in retirement spending, using the age 60-64 age band as the base year, and considering the relative decrease in retirement spending for older age bands.

The chart illustrates for all affluence levels there is a consistent reduction in spending across the age bands. In the ‘low affluence’ group, individuals aged 75+ spent approximately 15% less than those aged 60-64. This reduction is even more pronounced for the higher affluent levels, with spending at age 75+ band reducing 20-25% of the spending levels observed at age 60-64.

Chart 2: Average retirement spending by categories for ‘low affluence’ level across the age bands
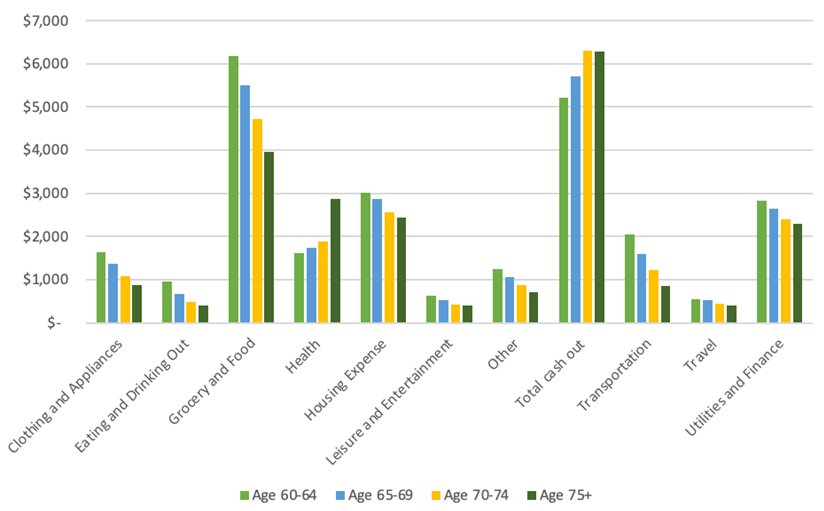
The chart illustrates, for the ‘low affluence’ level, how spending across the categories varies for different age bands.

For the ‘low affluence’ level, spending across most categories gradually decreases across the age bands, with the exception of health-related expenses and cash withdrawals.

Chart 3: Average retirement spending by categories for ‘high affluence’ level across the age bands
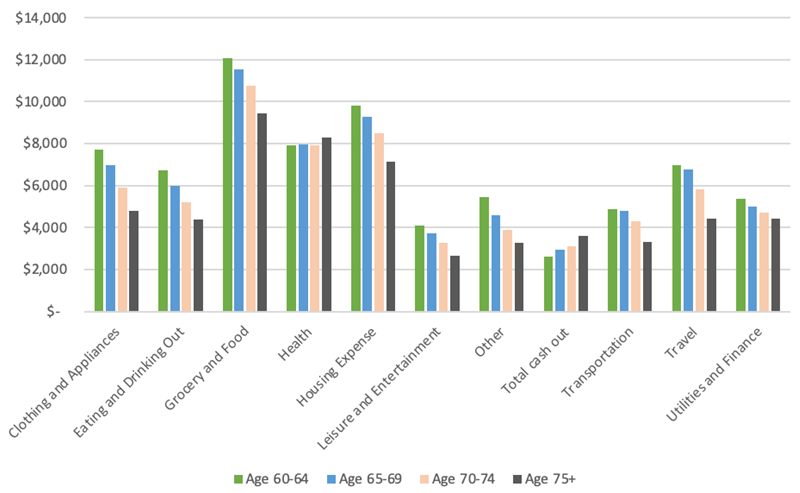
Similarly, for the ‘high affluence’ level, spending across most categories decreases with age, except for health expenses and cash withdrawals, albeit with less significant increases in health expenses compared to the ‘low affluence’ level.

It’s important to note that the banking data comprises all digital transactions and cash withdrawals from bank ATMs, excluding rent and mortgage payments. Therefore, it may not represent a complete picture of retirement spending. Furthermore, this data represents a snapshot in time, not a longitudinal study tracking the spending of the same retirees over time.

Understanding these limitations is crucial when drawing further conclusions. Nevertheless, the data underscores that retirees do not universally experience the same spending patterns in retirement. The income in retirement should reflect the potential spending pattern.

The impact of retirement spending patterns on the adequacy of retirement savings

To highlight the impact of different retirement spending patterns on the adequacy of savings for retirement, I have considered three different scenarios in the chart below by applying a different level of indexation to the initial income to reflect a spending pattern.

Under Scenario 1, the income remains constant in future nominal dollars and under Scenarios 2 and 3, the income is indexed with 2.5% per annum (in line with assumed CPI inflation) and 4% per annum (in line with assumed wage inflation) respectively.

Chart 4: Estimated retirement spending patterns in future dollars
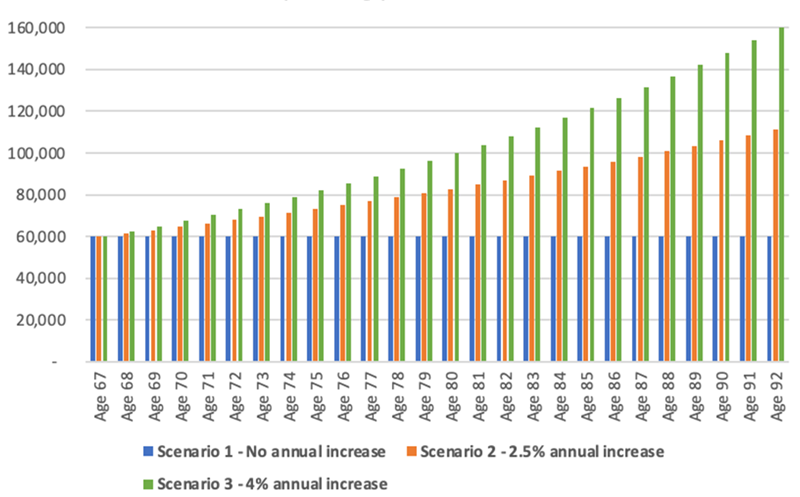
* The chart illustrates the spending pattern in future nominal dollars. In the calculations that follow, the amount of savings required at age 67 to maintain this spending level was calculated by adjusting the deflator in the retirement phase, whilst maintaining wage inflation at 4% per annum in the retirement phase. Age pension is expected to increase with wage inflation in the calculations.

Based on the three different retirement spending patterns, the amount of superannuation savings required at age 67 to maintain the spending pattern from age 67 until age 92 was calculated. The results are shown in the table below.

Chart 5: Savings required by age 67 to fund spending under different retirement spending patterns based on initial $60,000 per annum level

* Investment return in retirement 7% per annum after all fees and taxes. The income stream is expected to continue from age 67 to age 92. Age pension was included in the calculations and is expected to increase with wage inflation (4% per annum) under all scenarios. Age pension calculation is based on a single-person homeowner with financial assets equal to the required balance and pension rates as of 1 March 2023. The deflator in the retirement phase was changed under each scenario to match the chosen indexation rate and convert the balance savings amount required into today’s dollars.

The chart illustrates that, if retirement spending remains constant in nominal terms, $235,000 is needed at age 67 to maintain that spending level until age 92, after allowing for the Age Pension.

Allowing for a 2.5% annual spending increase requires an additional $225,000 in savings at the point of retirement, over a 95% increase in the amount required compared to Scenario 1. Factoring in a 4% annual increase requires a staggering 225% increase in savings at the point of retirement compared to Scenario 1.

This demonstrates how the assumed retirement spending pattern has a significant impact on the amount of savings required at the point of retirement, and retirees and advisers should consider what spending pattern would be most suitable, rather than simply using the default assumptions.


Ruvinda Nanayakkara is a Fellow of the Institute of Actuaries Australia and is the Manager, Product and Innovation at Spirit Super.


31 Comments
Keith
May 13, 2024

I have not seen any address the question of when one partner has to move into higher level of care while the other partner remains at their home, perhaps for 5 - 8 even 10 years. Depending on their assets and income, their savings has to meet a hefty week after week after week. There is no attempt to consider this major uncertainty. And of course during this timeframe, one or both has to meet significant medical expenses, the private health gap expenses for maybe a hip replacement or two. 

June
May 13, 2024

Excellent article, although I fear a little on the conservative side for costs. We have seen our home insurance increase 30% despite no claims (and have compared the market) our health insurance is $5,500/year and even staying with our van in a caravan park has increased exponentially. We are still in the early 70's and determined to "do it all" as we had neither the time nor money to do when younger.......ergo my comment that costs seem to be conservative, even in the "high affluence" band. One would also assume, that the high affluence band would probably not get the Age Pension either?

Ruvinda Nanayakkara
May 16, 2024

Hi June,
Thank you for your comment.
The costs are representative of an average Australian in the respective age ranges. There can be significant variation in spending even within the 'affluence bands' as well, so your personal spending level could be higher than the average. The data does not indicate whether the 'high affluence' band is receiving any Age Pension benefits so unfortunately I cannot comment on this.
I hope this provides bit more clarity.

Peter Vann
May 13, 2024

One simple rule of thumb I have found useful when considering the retirement spending smile is to translate an estimate of the flat drawdown (in real dollars) from your assets (eg from Money Smart or a stochastic retirement income calculator) into a higher initial drawdown and then have lower drawdowns later in retirement.

For example, if a retirement income calculator says that you have a good chance of not running out of money before you die by spending $100,000 p.a. from super, investments and any age pension, if applicable, then
a) start retirement by boosting retirement income by 15% obtaining a retirement income of $115,000 p.a. for say 10 years (inflating the income for inflation each year)
b) followed by a reduction of 3% (15%*2/10) each year for the next ten years ending up with approximately 15% less (in today’s dollars) than the initial flat retirement income estimate in the 20th retirement year.

The variable spending pattern from above has approximately the same probability of not running out of money before you die as the flat initial $100,000 p.a. (for the case backing my calculations). For simplicity I have separated out funding of end of life health/care costs that have unknown timing as these don’t change the outcome.

Steve G
May 12, 2024

In my thinking, if I left it to the usual calcs on savings and spending ratios in our retirement years it wouldn't be a very nice retirement experience. The loss of or primary years earnings being replaced by living off our fat, with ever changing gov policies and global conditions, and aiming for the 4% rule (or Morrisons 3+1%) seems like a lifestyle risk.
Sadly for me I don't trust nor rely on the usual calcs on savings balances etc. Instead I think of myself as being in a new career of an investor looking for growth and stellar returns from a range of investments to pursue similar to my earning years, and that will be perpetual, without draining the source capital.

Graham Wright
May 13, 2024

Been there, done that and firmly believe I have proven it good, at least for myself and my wife. 12 going on 13 years retired now. Seen good and bad investing years but achieved my basic objectives. My first learning, trust yourself and ignore professional advice. Such text-book advice was my greatest liability and proved costly. Safe for them, not for me. I always kept my focus on the current financial year, setting a budget and aiming for, but not always achieving, sufficient returns to fund the next year. Each year I reset my lifespan for another 25 years to keep a perspective on how long I want my funds to support us. Sooner or later, nature will intervene and time objectives will become shorter but for now, it keeps me mentally looking forward positively.
Key issues, spending gets less as age and health issues bite and wealth-wise that is an extention of your future financial support. You can fall back to the age-pension as a last resort and still survive. Govt-provided free and subsidised services are helpful but you always have the right to go it alone. The other is that age and health interfere with your investment capability and interest so you have to force yourself to keep focus or find trustworthy fund-managers to help you achieve your objectives. I always want to keep control and responsibility in my hands until I no longer can. A rule for life that applies everywhere, "Learn the rules thoroughly. You can bend them, twist them, tie them in knots BUT! NEVER EVER BREAK THEM" Especially applies in dealing with Govt Departments.

Alan
May 12, 2024

We are in our mid 70s. Our biggest cost is travel. We spend $20000 - $30000 per year. Anyone who has done a trip to Europe or USA realises how expensive it is because the exchange rate of the Australian dollar is so poor. Even cruises to NZ or within Australia are expensive. Our basic costs are going up 4% a year. We spend approximately $10000 per year each on house (rates, maintenance etc) car (single) and food. Our spending on basics since retirement has fallen but travel costs have increased!!

Dudley
May 12, 2024

Big Smart TV $300 / y,
Internet connection $500 / y
Incidentals $200 / y
Total $1,000 / y

Avoid hassles, risks, expense and disappointments - travel vicariously - the accommodation and weather is always better.

28yoMale
May 12, 2024

Any theories on the cash withdrawal category?

Peter Vann
May 11, 2024

The retirement spending smile. There is a body of research on this topic.

For example, David Blanchett has provided a literature review and some research in his 2014 paper "Exploring the Retirement Consumption Puzzle" in the Journal of Financial Planning.
https://www.financialplanningassociation.org/sites/default/files/2020-09/MAY14%20JFP%20Blanchett_0.pdf

Wade Pfau has simplified some of David’s key points in "What Is The ‘Retirement Spending Smile’?"
https://retirementresearcher.com/retirement-spending-smile/

Ruvinda Nanayakkara
May 16, 2024

Hi Peter
Thank you for your comment and sharing this research.
One consideration when looking at this research and applying this to an Australian context is how different countries structure their health care systems. Australia has a universal healthcare system, where costs are subsidised by the government and as I understand, the same level of coverage is not available in USA, where the original study was conducted. I am not an expert on the health case systems of the two countries so I can't comment further here.
The research to date coming from Australia seems to indicate that the increase in health related costs are smaller than the reduction in discretionary spending. I believe further research is required to understand this issue more deeply.

Aaron Minney
June 06, 2024

Peter
When you review the original Blanchett article you see that the smile appears in the chart of real growth. At older ages, the smile has increased back to zero. This means that the actual level of spending in not increasing at older ages.
The story of higher spending from the smile is not supported by the data. There are some people who have higher medical costs, but the aggregate (average) numbers indicate no large increase. In Australia, the data (as Ruvi notes) is that spending is still falling in real terms.
Note also that in the major studies, the decline is in real terms, and on average less than inflation. thus spending in nominal terms actually tends to increase.

Sri
May 10, 2024

I am not sure if this article takes into account any of the Insurance premiums that we all pay?
For example, for a couple health insurance is nearly $250 per month. And we have home and content insurance nearly $2000 per annum, Plus rates more than $4000 per year, Car insurance of $1500, per year, Car rego $1200 per year(in ACT) etc.

Phil
May 12, 2024

100% Sri. I'm renewing some insurance policies now. The cost increases are astonishing. My home insurance went from $935 two years ago to $1,200 this year. Other quotes were around $1,600.

DavidMC
May 12, 2024

I have ceased home and contents insurance for my home and holiday house. I have never if ever made a claim. I cannot see anyone wanting to steal any of their contents. Both are in low burglary areas. In the unlikely event of robbery, replacement cost is not great. Only if my house burned down would I be faced with significant expense, and what is the chance of that?
I object to paying high premiums for my very low risk because of the expense to insurers of those people who make bogus claims or live in high-risk burglary and natural disaster regions, including close to rivers prone to flooding and high-vegetation fire risk. I no longer have a mortgage.
Car and health insurance are different. Most of us will have at least one expensive motor vehicle claim, even if the accident is minor, and we are all eventually going to get sick and die! And look at the incidence of joint replacement surgery.

Irene
May 12, 2024

David, I think it’s not a good idea to ceased your home content insurance for both your home & holiday house. You might have to pay dearly if something happen. (Cross my fingers)

I suggest if you think of selling your holiday home, use the money (and interest) to rent when you go holiday.

Lyn
May 13, 2024

David, think twice for building insurance re if there is a fluke electrical fault, cost of repairs/rebuilding will be a killer.My house hit by lightning, luckily wires burnt out only back to appliances but could have been worse. Check fire alarms functional, NSW Fire Service has free advice/home visit.

PeterJ
May 18, 2024

RE "..Only if my house burned down would I be faced with significant expense, and what is the chance of that? .." - what is the chance of that - Suggest - Be careful with lithium batteries - or have none in your house or garage

PeterJ
May 18, 2024

Google the words common source of home fires
The results will give you plenty ideas of reducing "fire risk"

Ruvinda Nanayakkara
May 16, 2024

Hi Sri,
Thank you for your comment. I would like to clarify that the spending data includes health insurance costs and home and motor insurance costs if these are paid digitally using credit card, debit card, direct debit or BPay. The costs would be an average and the individual costs could vary significantly. So please consider these spending costs as an estimate for an average Australian and your individual circumstances could very from these estimates.
I hope this provides bit more clarity.

Graham Wright
May 10, 2024

Very important data showing how we need to consider funding for our retirement. It contrasts the common planning base where we are told that we should expect yesterdays lifestyle and expenses will continue long into our retirement.
The other unaddressed issue is how we change mentally as age and health impact our lifestyle in retirement. It is too easy to mourn and give up when faced with a loss of capacity to do what we enjoyed doing. However these changes can also open new doors to new opportunities. Living can evolve into new and totally different ways to do what we used to do. New experiences to bring different joys into our lives. Today's joys are still joys even if radically different to yesterday's joys. We can still do until we can no longer do, so do it and enjoy it before we have to stop.

Jan H
May 09, 2024

Your spending estimates don't seem to account the costs of in home care for those of us not wanting to go to aged care prison. For example, costs could include gardening/lawnmowing; house cleaning, cooking, shopping and even help with personal care, eg showering, transport etc. Even if A CAT assessed and receiving some govt help, there will still be out-of-pocket for salaries. This is why many retirees are saving up.

Ruvinda Nanayakkara
May 16, 2024

Hi Jan,
Thank you for your comment. The spending data is based on banking digital transactions (payments on credit cards, debit cards, direct debit, BPay and cash withdrawals). This excludes specific aged care costs but includes any Health related costs such as Hospitals, Health insurance, Ancillary services (physio, chiro, massage, etc), Dentists, GPs, Optometrists and Pharmacies paid digitally.
I hope this provides bit more clarity. I understand that aged care costs can be significant and unfortunately this wasn't part of the spending data for this analysis. Something that we will look to include in the future.

Aaron Minney
May 09, 2024

Hi Ravi
Thanks for sharing the data with everyone. There are great insights here.
I want to point out the impact of the longitudinal measurement that you mention in the article. This was referenced in the Retirement Income Review and in work by the Grattan Institute.
There is an observable cohort effect where subsequent retirees retire with a higher living standard than previous retirees. This ABS survey of Household Expenditure is a useful source to measure this impact. (It a pity that COVID effectively cancelled the 2020-21 version leaving a long gap still until the next release 2025-26 data).
Using the ABS data for households just before retirement, (aged 55-64) the average real increase in spending is around 1.8% p.a. For households five years apart, this means that later (younger) retiring household will have a lifestyle about 9% higher than the earlier (older) retiree. This lifestyle relativity tends to be maintained.
Once you adjust the cross-sectional data for this cohort effect you will find that spending (in aggregate) declines in real terms, but not by a lot.
Anecdotally, this data just supports the observation that boomer retirees want and have a better lifestyle than the silent generation of their parents.

Ruvinda Nanayakkara
May 16, 2024

Hi Aaron,
The work that Grattan Institute did by analysing the HES data was really useful and provided a quasi longitudinal dataset to assess how spending changes.
In that data and in the banking data I analysed, there is no consideration of the 'subjective experience' of retirees as they progress through retirement. I believe this is an important consideration because this will help us understand whether retirees can maintain same level of satisfaction even if their spending levels decline.
We can use other surveys on retiree satisfaction to get an understanding here but I think it will be powerful if two sources can be combined in a longitudinal study.

David Bell
May 09, 2024

Thanks Ravi for sharing this research - it is an important issue and, as your results show, makes a significant difference to how much savings you need for retirement. I'm glad you also called out the issues that this research doesn't track a single cohort through time. This links to related issues of whether spending was constrained by means etc.. Your research is highly valuable, and hopefully prompts further research and discussion.
Cheers, David

Ruvinda Nanayakkara
May 16, 2024

Thanks David, I agree there needs to be further research and discussions to truly understand how spending changes as people progress through retirement. I agree one aspect that is not covered is the 'subjective experience' of retirees as they progress through retirement. If their spending is curtailed and this is due to them having less resources, then their experience would be negative than someone reducing their spending voluntarily.

Cam
May 09, 2024

Its important to know people spend less as they age. Younger retirees can spend a little more as a result. That's important as some miss a dream holiday in early retirement for fear of running out of money, only to later find they won't run out, and they missed a couple of lifetime dreams.
I think the spending reduction is more about health decline than age, though the two are obviously correlated. For a couple, decline in one affects both.
Retirees, especially in Sydney and Melbourne, can get a huge increase in home equity over time. Some could access $50k a year and still have an increase in home equity. A separate topic is whether that's fair, compared to people in smaller capitals and rural and regional locations.

Dudley
May 09, 2024

"This data was extracted from the Compare My Spend tool on the Spirit Super website.":
https://www.spiritsuper.com.au/Retirement/Compare-my-spend

'Most people aged 70-74, living in the ACT Metro area spent less than $2,474 per fortnight (excluding rent or mortgage) in 2023. Here's what they spent on:'

'Grocery and Food $415'

'Spending is shown for an approximate income in the range $3,001 or over per fortnight during the years leading up to retirement, and is shown for a single person and not a couple.'

If that is a single 70-74 year old spending $207.50 / w for Grocery and Food, then that likely explains the Health cost of $174 / w.

To what age would such a single live and thus how much capital would be required?

Can two live longer (more capital) and cheaper (less capital) than one?

Ruvinda Nanayakkara
May 16, 2024

Thank you for your comment.

In order to figure out how long one could expect to live, you will have to rely on life expectancy calculations to understand how long does an 'average person' is expected to live. You can find a life expectancy calculator online that will give you this answer.

To figure out how much capital you need to maintain your spending for the remaining life, this will have to be calculated by considering few more inputs (such as, how the capital will be invested, what is your spending level and whether you want your spending level to increase, fees and charges, etc). Probably best to talk to a financial advisor or you might be able to use an online pension calculator to work this out.

I hope this answers your questions.

Dudley
May 16, 2024

"to figure out how long one could expect to live, you will have to rely on life expectancy calculations to understand how long does an 'average person' is expected to live":

Married men live longer (until they divorce):
'Study after study shows that married people eat better and are less likely to smoke and drink excessively.'
https://fortune.com/2023/01/13/why-are-married-men-healthier-on-average-women-gender-research/


Leave a Comment:


RELATED ARTICLES

How much do you need to retire comfortably?

Retirement spending: set the bar lower

banner

Most viewed in recent weeks

Vale Graham Hand

It’s with heavy hearts that we announce Firstlinks’ co-founder and former Managing Editor, Graham Hand, has died aged 66. Graham was a legendary figure in the finance industry and here are three tributes to him.

The nuts and bolts of family trusts

There are well over 800,000 family trusts in Australia, controlling more than $3 trillion of assets. Here's a guide on whether a family trust may have a place in your individual investment strategy.

Welcome to Firstlinks Edition 583 with weekend update

Investing guru Howard Marks says he had two epiphanies while visiting Australia recently: the two major asset classes aren’t what you think they are, and one key decision matters above all else when building portfolios.

  • 24 October 2024

Warren Buffett is preparing for a bear market. Should you?

Berkshire Hathaway’s third quarter earnings update reveals Buffett is selling stocks and building record cash reserves. Here’s a look at his track record in calling market tops and whether you should follow his lead and dial down risk.

Preserving wealth through generations is hard

How have so many wealthy families through history managed to squander their fortunes? This looks at the lessons from these families and offers several solutions to making and keeping money over the long-term.

A big win for bank customers against scammers

A recent ruling from The Australian Financial Complaints Authority may herald a new era for financial scams. For the first time, a bank is being forced to reimburse a customer for the amount they were scammed.

Latest Updates

Shares

Looking beyond banks for dividend income

The Big Four banks have had an extraordinary run and it’s left income investors with a conundrum: to stick with them even though they now offer relatively low dividend yields and limited growth prospects or to look elsewhere.

Exchange traded products

AFIC on its record discount, passive investing and pricey stocks

A triple headwind has seen Australia's biggest LIC swing to a 10% discount and scuppered its relative performance. Management was bullish in an interview with Firstlinks, but is the discount ever likely to close?

Superannuation

Hidden fees are a super problem

Most Australians don’t realise they are being charged up to six different types of fees on their superannuation. These fees can be opaque and hard to compare across different funds and investment options.

Shares

ASX large cap outlook for 2025

Economic growth in Australia looks to have bottomed, which means it makes sense to selectively add to cyclical exposures on the ASX in addition to key thematics like decarbonisation and technological change.

Property

Taking advantage of the property cycle

Understanding the property cycle can be a useful tool to make informed decisions and stay focused on long-term goals. This looks at where we are in the commercial property cycle and the potential opportunities for investors.

Investment strategies

Is this bedrock of financial theory a mirage?

The concept of an 'equity risk premium' has driven asset allocation decisions for decades. A revamped study suggests it was a relatively short-lived phenomenon rather than the mainstay many thought.

Vale Graham Hand

It’s with heavy hearts that we announce Firstlinks’ co-founder and former Managing Editor, Graham Hand, has died aged 66. Graham was a legendary figure in the finance industry and here are three tributes to him.

Sponsors

Alliances

© 2024 Morningstar, Inc. All rights reserved.

Disclaimer
The data, research and opinions provided here are for information purposes; are not an offer to buy or sell a security; and are not warranted to be correct, complete or accurate. Morningstar, its affiliates, and third-party content providers are not responsible for any investment decisions, damages or losses resulting from, or related to, the data and analyses or their use. To the extent any content is general advice, it has been prepared for clients of Morningstar Australasia Pty Ltd (ABN: 95 090 665 544, AFSL: 240892), without reference to your financial objectives, situation or needs. For more information refer to our Financial Services Guide. You should consider the advice in light of these matters and if applicable, the relevant Product Disclosure Statement before making any decision to invest. Past performance does not necessarily indicate a financial product’s future performance. To obtain advice tailored to your situation, contact a professional financial adviser. Articles are current as at date of publication.
This website contains information and opinions provided by third parties. Inclusion of this information does not necessarily represent Morningstar’s positions, strategies or opinions and should not be considered an endorsement by Morningstar.