Register For Our Mailing List

Register to receive our free weekly newsletter including editorials.

Home / 541

Welcome to Firstlinks Edition 541

  •   4 January 2024
  • 13
  •      
  •   

The Weekend Edition includes a market update plus Morningstar adds links to two additional articles.

Welcome back to Firstlinks and the start of a new year. I hope you had a refreshing and safe festive season.

Last year was a good one for almost every major asset. Bitcoin led the pack, rising 156%, while commodities were the only asset with negative returns.

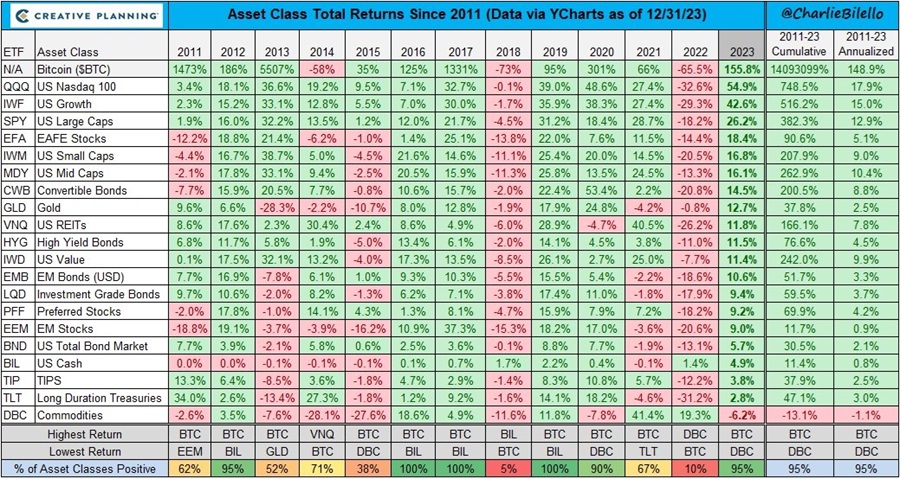
After 2022 where only 10% of assets had positive returns, 2023 flipped the script with 95% of assets in positive territory.

The Nasdaq 100 had an extraordinary bounce back, leaping 55% higher last year, led by the ‘Magnificent Seven’ tech stocks. That resulted in US growth and large caps also outperforming. The Nasdaq left the S&P 500 in the dust though the latter still had a strong 26% return for 2023. Mid and small caps again trailed the indices both in the US and Australia. Meanwhile, REITs were surprisingly strong despite headwinds from rising interest rates and trends such as work-from-home. Emerging markets were a notable laggard, dragged down by poor performance from China. And commodities were lower for the year as oil prices plummeted from their highs in 2022.

The ASX 200 was up 7.8% for 2023 in Australian dollar terms (though similar in USD). That’s a decent return though looks meek compared to the world ex-US return of 18.6%. The ASX performance shouldn’t surprise given the index is dominated by slow-growing banks and commodity stocks, which were hit by those falling commodity prices.

From the chart above, it’s notable that asset returns for 2023 largely continued trends that have been happening for most of the past decade. Defying the naysayers, Bitcoin has returned 149% per annum (p.a.) since 2011. The Nasdaq is up 18% p.a. over the same period. Meanwhile small caps, value stocks, and emerging markets have all lagged badly.

Market predictions and the ‘I don’t know’ club

What do the results of 2023 mean for this year? Your email inbox has no doubt been inundated with predictions about where the market and various assets are heading in 2024. These predictions generally fall into two categories: extrapolating last year’s returns into the future or forecasting a reversion to the mean for returns.

Let’s call the first bucket of forecasters, the market extrapolators. They say you should stick with the strong. The markets, sectors, and companies that have recently performed well will continue to do so. That means the US, tech, and large caps should continue to beat the rest, riding trends such as AI, robotics, and the cloud/data. Investors in this bucket primarily fall into the ‘growth’ and/or ‘momentum’ category.

The second bucket of forecasters can be called the mean-reverters. They say extrapolating from recent market performance is dangerous and falls into the trap of a psychological bias known as recency bias. They believe returns revert to the mean in the long-term. Investors here generally fall into the ‘value’ category and favour value stocks, emerging markets, and commodities going forward. Famed investors in the mean reversion camp include GMO’s Jeremy Grantham and Research Affiliates’ Rob Arnott.

Critics of mean-reverters suggest they ignore that some assets are better than others and are unlikely to mean revert. For example, tech has been riding a 30-year wave of innovation and that’s unlikely to end any time soon. On the flip side, commodities are perennial long-term underperformers and that is unlikely to change in future.

What both categories of market predictors have in common is that they think they can predict the future. That though the future is uncertain, there are patterns which can be identified and forecast.

Yet, most forecasters are deluding themselves. They can’t predict the future. For some, the delusion is forced on them through working for institutions whose investors expect predictions, and forecasts are a form of marketing for these institutions to increase their funds under management.

But investors are to blame too. Most people hate uncertainty and predictions provide a degree of comfort about the future.

I’d like to propose an alternative. Let’s call it the ‘I don’t know’ club. The mission statement of the club could read something like this:

“We don’t have a clue about what 2024 and beyond will bring. The future is uncertain. We see no need to predict an imaginary future to reduce this uncertainty. Instead, we’ll focus on those things that we can control, rather than those we can’t.”

Focusing on what matters

What should investors focus on, then? There are three drivers for future returns from markets and stocks: the starting dividend yield, earnings growth, and change in price to earnings multiple. Or in formula terms:

Starting net yield + earnings growth rate + % change in earnings multiple = future return p.a.

Investors don’t have any control over the multiple that the market will attach to an index or stock. The biggest driver of future returns is likely to come from the earnings growth rate. If you can buy quality businesses with competitive advantages and pricing power that will earn much more in 5-10 years’ time than they do now, the returns from these stocks should reflect this in the long-term. And this business growth will in turn drive market returns.

Earnings are what matter, and that’s where investors should focus their attention. Market commentary outside of that is largely a distraction.

The next two charts illustrate this point. The first comes from one of the best global fund managers, Canada-based Francis Rochon. Each year, Rochon compares the annual earnings growth and yield from his portfolio of companies against the market value ascribed to these companies.

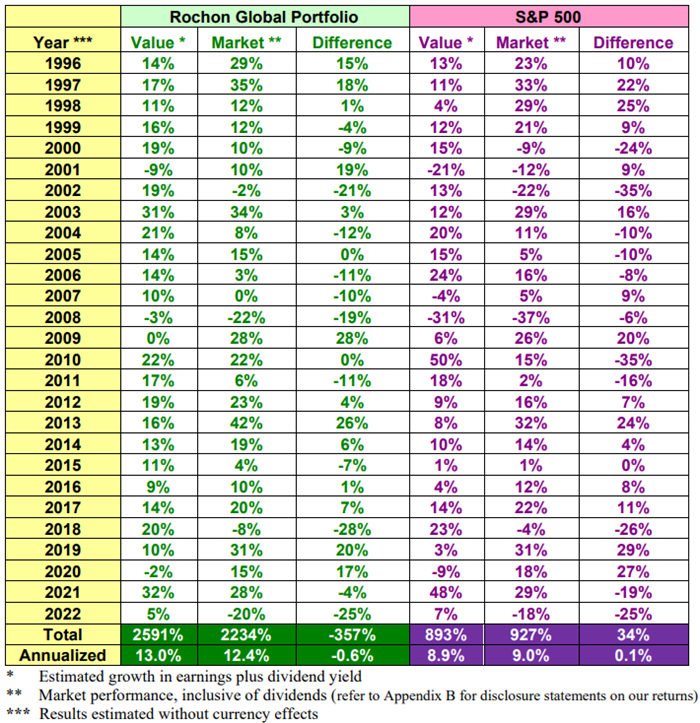
In 2022 for instance, Rochon’s portfolio had earnings growth plus a dividend yield of 5%, yet the market value of his portfolio went down by 25%. Similarly, the S&P 500 yield and earnings growth increased by 7% in 2022 but the market value of the index fell 18%.

However, in the long term, the earnings growth and yield largely mirrors the resulting market value. Rochon’s portfolio delivered a dividend yield and earnings growth of 13% annually over the 25 years to 2022, and the market value of his portfolio went up by 12.4% p.a.. Likewise for the S&P 500, EPS growth plus the dividend yield increased 8.9% p.a. over the same period, and the market value for the index rose by a similar amount.

In other words, markets are volatile and may not reflect the underlying earnings of businesses in the short-term. Yet market returns tend to converge with underlying business earnings growth and yields in the long-term.

The second chart is a little different yet makes a similar point.

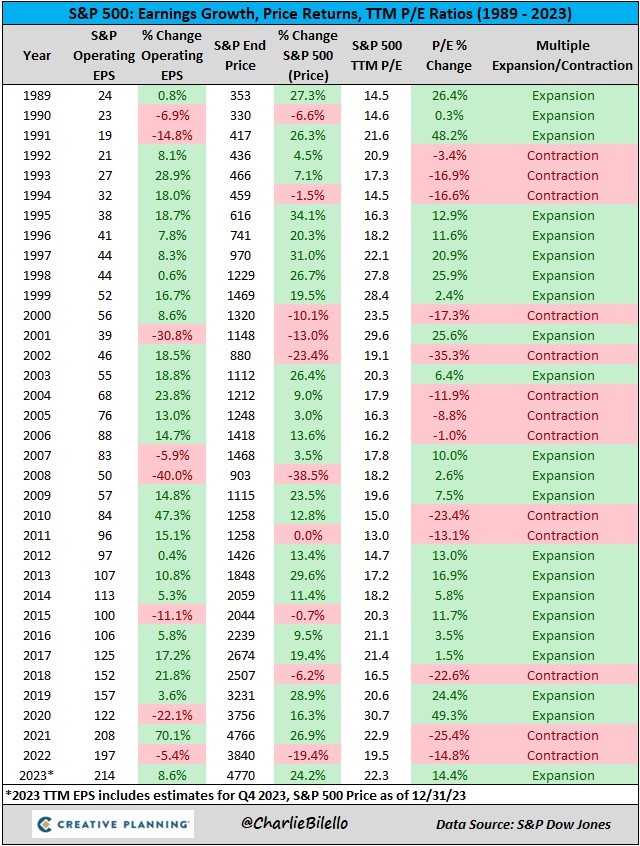
S&P 500 earnings for 2023 are likely to increase 8.6%, yet the market ex-dividend yield climbed 24%. The difference comes from the price-to-earnings (PER) multiple for the index rising from 19.5x in 2022 to 22.3x in 2023.

Historically, the PER multiple has fluctuated from as low as 13x in 2011 to as high as 29.6x in 1999. What’s remarkable though is how consistent earnings growth has been during the past 34 years. 2023 earnings are likely to be close to double those of 10 years ago (2013), which were roughly double those of the decade prior to that (2003), which were about double those of 10 years before that (1993). Using the rule of 72, doubling earnings over 10 years means earnings growth of about 7% p.a. It’s happened like clockwork over more than 30 years.

That earnings growth isn’t assured in future. What is more certain is that the starting yield and earnings growth of stocks and markets will continue to drive long-term returns.

James Gruber

Also In this week's edition...

As Firstlinks enters its 12th year of publication, Graham Hand goes back over the past 540 editions and finds some of our most popular and standout articles. Graham also provides a brief update on his health.

Two extra articles from Morningstar for the weekend. Shani Jayamanne reports on how Qantas' costs are rising and the implications for the carrier, while Susan Dziubinski looks at 33 undervalued US stocks for 2024

In this week's whitepaper, Orbis writes of how it's preparing for a new investing environment over the next decade.

**

Weekend market update

On Friday in the US, the major indices all gained modestly after stronger than expected jobs data clouded the interest rate outlook. Payrolls increased by 216,000 and the unemployment rate held steady at 3.7%. The &P 500 finished up 0.2% while the Nasdaq rose 0.1%. US Treasury yields initially spiked higher, then pared their advance. The 10-year yield ended four basis points higher to 4.04%. 

From AAP Netdesk:

The local share market on Friday finished slightly lower. The benchmark S&P/ASX200 index on Friday gave up its modest morning gains in the afternoon to close five points lower at 7,489.1, a dip of 0.07%. The broader All Ordinaries dropped 12.2 points, or 0.16%, to 7,718.4. The ASX200 dropped 1.3% for the holiday-shortened week, snapping its five-week winning streak that saw it gain 7.3%.

The ASX's 11 sectors closed mixed, with five up, five down and utilities basically flat.

Tech was the biggest mover, dropping 2.1%, as Xero fell 2.3% and Wisetech Global retreated 3.8%.

Core Lithium plunged 9.6% to a year-and-a-half low of 23c after confirming it would temporarily cease production at its Grants open-pit mine near Darwin, which opened to great fanfare just a year ago. The move was driven by the plunging price of lithium ore, whose price is down more than 85% in the past 12 months, including by 50% since the end of October.

Elsewhere in the mining sector, BHP fell 1.0% to $49.07, Fortescue dropped 2.6% to $28.19 and Rio Tinto retreated 1.6% to 4132.36.

Goldminers did well, however, as rising geopolitical tensions in the Middle East boosted the price of the yellow metal, with Northern Star gaining 1.3% and Newmont rising 1.1%.

Among the Big Four banks, CBA added 1.4% to $112.99, Westpac advanced 1% to $22.86 and ANZ and NAB had both gained 0.3%, to $25.62 and $30.56, respectively.

Latest updates

PDF version of Firstlinks Newsletter

LIC Monthly Report from Morningstar

ASX Listed Bond and Hybrid rate sheet from NAB/nabtrade

Listed Investment Company (LIC) Indicative NTA Report from Bell Potter

Plus updates and announcements on the Sponsor Noticeboard on our website


13 Comments
Frank
January 07, 2024

Given the performance of Bitcoin as indicated above, do you think that an allocation to Bitcoin in a diversified portfolio with a long term outlook, would have merit?

Allan
January 07, 2024

Given we've now long-had a 'Fiat currency', Frank,...in the race to the bottom, steer clear of Bitcoin before (p)its wobbly weal comes off.

Frank
January 08, 2024

Perhaps you could expand on the actual problems with Bitcoin Allan. You seem to be knowledgeable on the subject where as I am not.

Kevin
January 05, 2024

Checking the CBA shareholder letter (9/2/22 ) then the 400 shares cost $2160.

The share price was $99.56 and the shares with dividends reinvested were worth $220,891, so you had 2218 shares.

I'll not be able to get out of the door in the morning,my head will block the doorway.What a prediction for 30 years into the future,2400 shares I thought ,and you had 2218.

Steve
January 05, 2024

Sorry James & Rob but I have to repeat my current pet peeve - an accumulation index that leaves out franking credits is a half-way house. Franking credits are real money, you declare them as income on your tax return. So if you are trying to show the actual overall return from both changes in the price index as well as income produced you cannot ignore franking credits as they are a significant contributor to the income component. Typically they add about 1.5% so your 7.7% should be closer to 9.2% (give or take). Over 10 years 7.7% compounded will produce an overall return of 110%, 9.2% compounded will produce about 140%, about 27% higher.
While its no drama plebs like me and other readers using accumulation indexes in a simplistic manner I continue to hope more professional outfits like Firstlinks and their primary contributors could raise the bar when discussing "Total" returns.

Kevin
January 05, 2024

Steve franking credits are not part of an accumulation index.If I have $50K of gross dividends from Fortescue I don't get $50K worth of shares in the DRP, I get $35K worth of shares. The franking credit is tax paid and is grossed up for your tax form. When I bought CBA way back when at the IPO I calculated the shares I held would compound @6% a year,using rule of 72 I would double my shareholding every 12 years.When they sent the shareholder letter out for 30 years I was stunned at how accurate I was for 30 years. From memory you had 2214 shares,on my maths it would be 2400 shares starting at a base of 400 shares @ $5.40 each ( their calculation).They had gone from $5.40 each to $99. xx and had a value of ~ $220K,slightly over. The dividend statement gives you the same info every year.Number of shares X dividend,that is how much is reinvested into more shares,if it is full DRP.The last column is the franking credit ,or tax paid,back in 1991 39% if I remember rightly. I don't anybody that works on tax paid as part of TSR. TSR to me has always been the total number of shares if all dividends are reinvested,or the acc index.Using my basic maths then you would have around say 6300 shares in CBA starting at a base of 1000 shares ,~$6K back then,it was scaled back if I remember correctly so you needed to buy them on market. Today around 6300 X $110,it's been a great company to own for medium term investing.Once it gets to 50 years of holding it then I can begin to think about how it performs in the long term.Sadly I won't be here in 17 years so I will not know. However on my rough maths from a base of 1000 shares doubling every 12 years then 1,2,4,8, 16,000 .The rounding up to 50 years would allow for error and will probably be wrong.To get it roughly right rather than precisely wrong then 16,000 shares at $150 to $250 each in 2041.

Steve
January 06, 2024

Hi Kevin. I get your point that only the actual dividend amount qualifies for a DRP, but that still misses the point that the franking credit has been received and will offset tax otherwise payable from your own pocket if the franking credit had not been received. It seems to come down to how you view franking credits - in your mind it seems that you only view them as a tax offset, not a further source of return, hence you don't factor it into TSR.
Ironically if there were no franking credits the TSR by your mind would be the same (no change to accumulation index as it does not allow for franking.) Can you really rationalise non-franked dividends as delivering the same overall return as fully franked dividends?
If you have 1000 shares of CBA you would have received over the last 12 months $4.50 x 1000 = $4500 dollars, as shares at say $100 each you would get 45 new shares. But the franking credit that comes with this is $4500/0.7-$4500 = $1928, worth about 19 more shares. You could therefore choose to use this to offset your tax (you could also take the dividend as cash and use this to cover a tax bill if you wanted, but you would lose your compounding), or you can buy another 19 shares, which would give you 64 new shares rather than 45, which will increase your compounding. No new shares, 45 new shares or 64 new shares - the choice is yours. Just because you choose to use the franking credit to offset tax because it is convenient does not make it any less valuable or real than the dividend you chose to take as shares. This is most clearly the case in pension phase or when personal income is below the tax free threshold when the franking credits are refunded in full - the day the refund arrives in your account you can simply use the refund to buy more shares. Does that not enhance your compounding outcome? Now the crux of this is if the accumulation index does not capture this enhanced outcome, it is clearly inadequate as a means for comparison. Full stop.
I wasn't aware until recently (thanks to Dudley) that there is an index that captures franking credits from S&P, copied below. For the 10 years to today, the ASX200 price return is 3.43%, the total return (accumulation index) is 7.8% and the franking credit adjusted return is 9.34% (so the nominal 1.5% boost is clearly close). They also have indexes for superannuation which I believe allows for the 15% tax on income in super (which comes to 8.41% over the last 10 years out of interest). As I suspect most people have the majority of their investable assets in super, the franking credits will offset the 15% tax and allow more units in whatever investments you have chosen to be purchased, hence the higher return than the accumulation index.
https://www.spglobal.com/spdji/en/indices/equity/sp-asx-200/#overview

Steve
January 08, 2024

A bit more background on the franking credit adjusted indices from S&P.
https://www.spglobal.com/spdji/en/documents/additional-material/faq-asx-franking-credit-adjusted-indices.pdf

Rob Smith
January 04, 2024

Hi James A great article in particular the various asset class returns since 2011. Would you please provide similar data on what the ASX 200 accumulation index did since 2011 for comparison purposes. many thanks Rob

James Gruber
January 04, 2024

Hi Rob, I've got the ASX 300 Acc Index returns below. Hope that helps.


ASX 300 Accumulation Index


2023 8.2%


2022 -1.8%


2021 17.5%


2020 1.73%


2019 23.77%


2018 -3.06%


2017 11.94%


2016 11.79%


2015 2.80%


2014 5.30%


2013 19.68%


2012 19.74%


2011 -10.98%


Cumulative gain 164%


Annual return 7.7%

Rob Smith
January 06, 2024

Many thanks for that James

Rob Prugue
January 04, 2024

Einstein goes to the Pearly gates. He approaches St Peter and asks if he can stay there to greet other geniuses. St Peter agrees.

Einstein waits patiently and sees a distinguished looking gentleman. He approaches and introduces himself, then asking what his IQ was. The gentleman answers, “135”. Impressed, Enstein asks if one day he’d like to meet to discuss and debate Nietzsche’s views on the meaning of life.

Einstein returns to the gate and wait for the next genius to approach. He sees a woman who clearly looks like a scientist. He approaches her and asks for her IQ. She responds, “145”. “Brilliant”, Einsteins responds, “Let’s meet and discuss my theory of relativity and how it fits with the existence black holes.”

Einstein returns to the gates and waits for the next genius. He approaches another distinguished looking gentleman and asks the same question, what is your IQ? The gentleman looks perplexed, stumbles, and sheepishly answers “68”. Einstein smiles and asks, “So where do you see the ASX 100 in twelve months time?”

While clearly a joke, it’s not too surprising that theamagent firms which publish their 12 month index forecast often have a high retail bias, where the “forecasting” is often driven and answered by the marketing department.

Maurie
January 08, 2024

That sounds like an adaptation of a Dave Allen joke without the references to an Irishman, a Priest and God


Leave a Comment:

banner

Most viewed in recent weeks

Are term deposits attractive right now?

If you’re like me, you may have put money into term deposits over the past year and it’s time to decide whether to roll them over or look elsewhere. Here are the pros and cons of cash versus other assets right now.

Uncomfortable truths: The real cost of living in retirement

How useful are the retirement savings and spending targets put out by various groups such as ASFA? Not very, and it's reducing the ability of ordinary retirees to fully understand their retirement income options.

How retiree spending plummets as we age

There's been little debate on how spending changes as people progress through retirement. Yet, it's a critical issue as it can have a significant impact on the level of savings required at the point of retirement.

Where Baby Boomer wealth will end up

By 2028, all Baby Boomers will be eligible for retirement and the Baby Boomer bubble will have all but deflated. Where will this generation's money end up, and what are the implications for the wealth management industry?

Is Australia ready for its population growth over the next decade?

Australia will have 3.7 million more people in a decade's time, though the growth won't be evenly distributed. Over 85s will see the fastest growth, while the number of younger people will barely rise. 

20 US stocks to buy and hold forever

Recently, I compiled a list of ASX stocks that you could buy and hold forever. Here’s a follow-up list of US stocks that you could own indefinitely, including well-known names like Microsoft, as well as lesser-known gems.

Latest Updates

Property

Financial pathways to buying a home require planning

In the six months of my battle with brain cancer, one part of financial markets has fascinated me, and it’s probably not what you think. What's led the pages of my reading is real estate, especially residential.

Meg on SMSFs: $3 million super tax coming whether we’re ready or not

A Senate Committee reported back last week with a majority recommendation to pass the $3 million super tax unaltered. It seems that the tax is coming, and this is what those affected should be doing now to prepare for it.

Economy

Household spending falls as higher costs bite

Shoppers are cutting back spending at supermarkets, gyms, and bakeries to cope with soaring insurance and education costs as household spending continues to slump. Renters especially are feeling the pinch.

Shares

Who gets the gold stars this bank reporting season?

The recent bank reporting season saw all the major banks report solid results, large share buybacks, and very low bad debts. Here's a look at the main themes from the results, and the winners and losers.

Shares

Small caps v large caps: Don’t be penny wise but pound foolish

What is the catalyst for smalls caps to start outperforming their larger counterparts? Cheap relative valuation is bullish though it isn't a catalyst, so what else could drive a long-awaited turnaround?

Financial planning

Estate planning made simple, Part II

'Putting your affairs in order' is a term that is commonly used when people are approaching the end of their life. It is not as easy as it sounds, though it should not overwhelming, or consume all of your spare time.

Financial planning

Where Baby Boomer wealth will end up

By 2028, all Baby Boomers will be eligible for retirement and the Baby Boomer bubble will have all but deflated. Where will this generation's money end up, and what are the implications for the wealth management industry?

Sponsors

Alliances

© 2024 Morningstar, Inc. All rights reserved.

Disclaimer
The data, research and opinions provided here are for information purposes; are not an offer to buy or sell a security; and are not warranted to be correct, complete or accurate. Morningstar, its affiliates, and third-party content providers are not responsible for any investment decisions, damages or losses resulting from, or related to, the data and analyses or their use. To the extent any content is general advice, it has been prepared for clients of Morningstar Australasia Pty Ltd (ABN: 95 090 665 544, AFSL: 240892), without reference to your financial objectives, situation or needs. For more information refer to our Financial Services Guide. You should consider the advice in light of these matters and if applicable, the relevant Product Disclosure Statement before making any decision to invest. Past performance does not necessarily indicate a financial product’s future performance. To obtain advice tailored to your situation, contact a professional financial adviser. Articles are current as at date of publication.
This website contains information and opinions provided by third parties. Inclusion of this information does not necessarily represent Morningstar’s positions, strategies or opinions and should not be considered an endorsement by Morningstar.